
Oil has now climbed for four straight sessions, with CL pressing $85 after June’s U.S.–Iran memorandum of understanding expired and President Trump ruled out extending it. But the positioning data traders are leaning on this week was frozen in time before any of that happened and that gap is the real story for anyone sizing a crude position right now.
What the Latest Report Actually Shows
The most recent Commitments of Traders (COT) report from the CFTC, the weekly snapshot of who is positioned which way covers positions as of Tuesday, August 11, and was released last Friday.
It shows managed money (the hedge funds and large speculators that drive momentum) holding a net long of roughly 79,900 contracts in NYMEX WTI: 190,554 long against 110,638 short, out of total open interest near 1.89 million.
That net long is light. It sits well below the 100,000-plus specs were carrying in late July, and it reflects the long liquidation that followed the early-August peace-trade crash, when crude gave back more than 10% in two sessions.
In plain terms: by August 11, the fast money had already been shaken out and was running a cautious, de-risked book.
Latest CFTC COT — NYMEX WTI (managed money, futures only)
| Metric | Reading |
|---|---|
| Managed Money Net Long | 79,900 Contracts |
| Gross Long | 190,554 |
| Gross Short | 110,638 |
| Open Interest | 1,892,429 |
| Snapshot Taken | Tue, Aug 11 (released Fri, Aug 14) |
| Next Report | Fri, Aug 21. Positions as of Aug 18 |
Why That CoT Number is Already Stale
Here is the catch. The August 11 snapshot predates the catalyst that is actually moving price. The 60-day negotiating window from June’s MOU expired on August 16–17, Trump said he had no interest in extending it, and the U.S. naval blockade stayed in place. That is what drove crude’s four-day run to $85.
None of it is in the latest COT.
So the “latest positioning” number understates the story. When you see 80,000 net long quoted this week, remember it was measured before the trade that mattered.
The report that captures the rally positions as of August 18 does not publish until Friday, August 21.
The Two-Sided Read
That lag creates a clean, two-sided setup. The bullish read: specs went into this rally light, so a move to $85 built on a de-risked book means fresh longs are being added, not piled onto an already-crowded position which leaves room to run. If that is right, Friday’s report should show managed money net long jumping and open interest rising.
The bearish read: if the push higher is thin short-covering rather than genuine new conviction, Friday will expose it, flat net long, or falling open interest. That leaves the rally hollow and vulnerable to a fade, especially with the structural overhang still in place: OPEC+ has finished unwinding its cuts, and both the IEA and EIA have trimmed demand forecasts.
Either way, the level is not the signal. The quality of the change is fresh money versus short-covering versus forced liquidation and that only becomes visible on Friday.
Oil (CL) One-Hour Technical Outlook
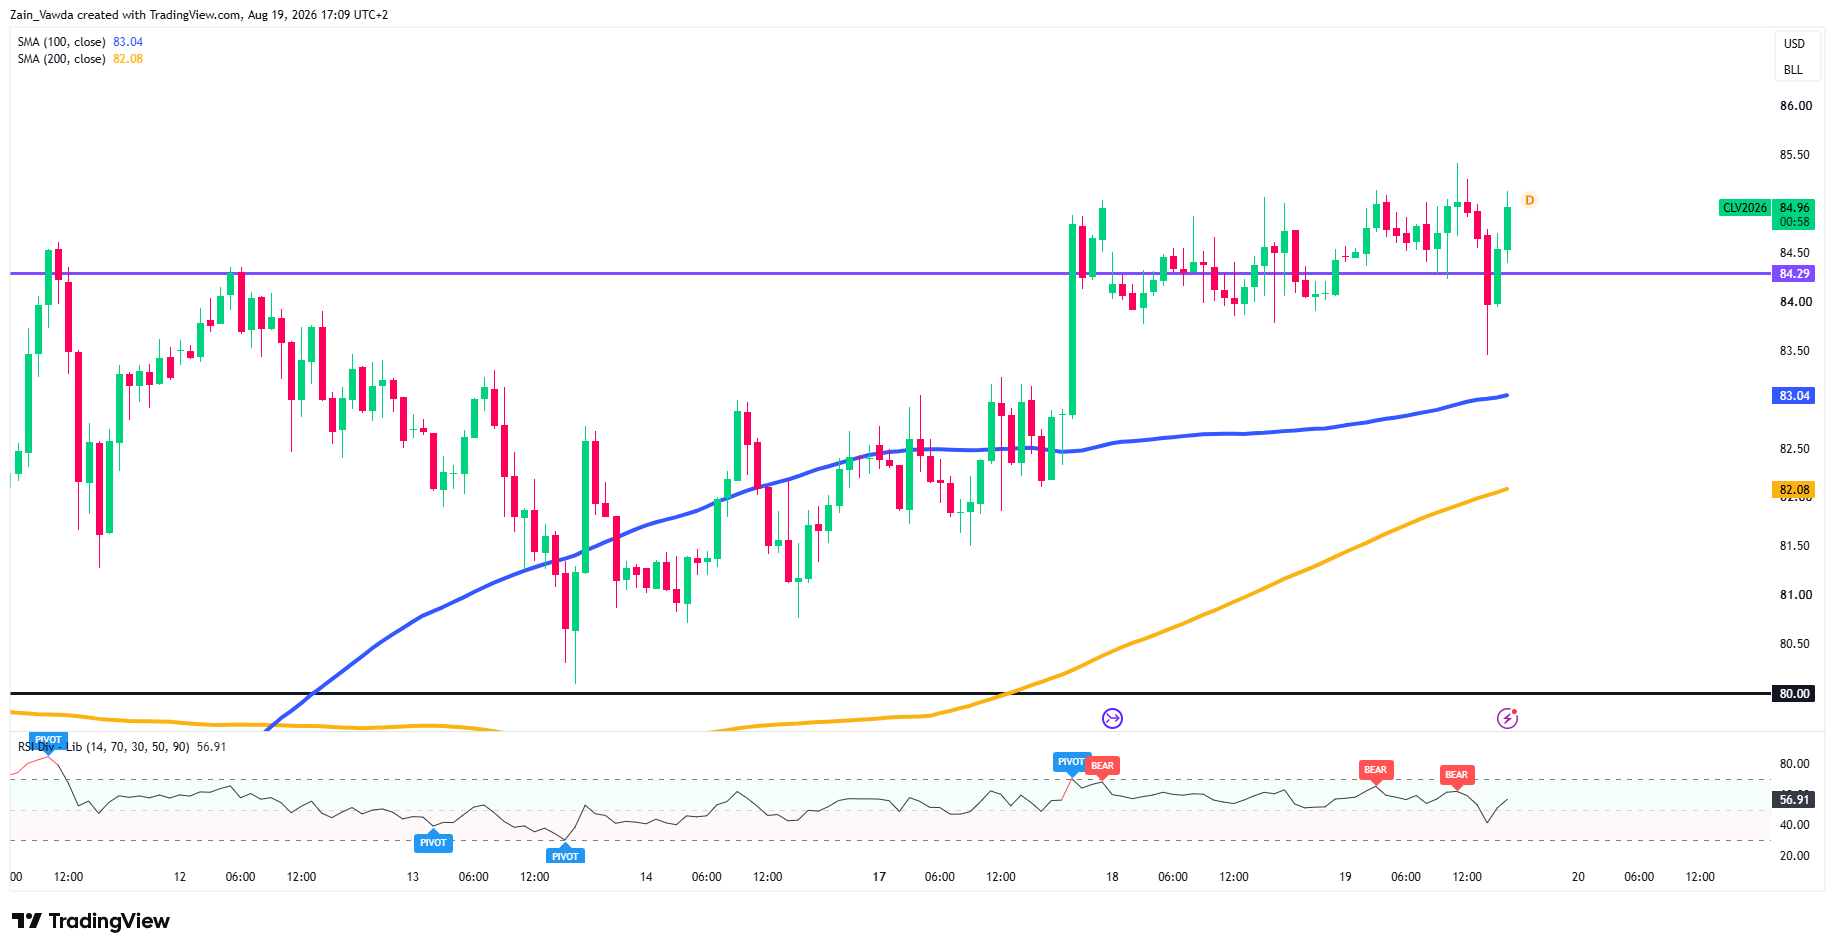
On the one-hour chart, CL trades near 84.96, back above the 84.29 level that has now flipped from a ceiling into a floor.
Oil (CL) One-Hour Chart, August 19, 2026
Source: TradingView
The midday drop briefly broke below it toward 83.50, but buyers stepped straight back in, a failed breakdown that keeps the near-term bias higher.
Price sits comfortably above both moving averages, with the rising 100-hour MA at 83.04 and the 200-hour MA at 82.08 stacked underneath, confirming the uptrend off the August 13 swing low.
The one warning is momentum: RSI at 56.91 has bounced back from the dip, but repeated bearish divergence flags at the recent highs suggest the push toward 85.40 lacked conviction. Bulls need to hold 84.29; lose it and 83.04, then 82.08, come back into play.
Trader Positioning Data
Profitable traders treat the stale CoT number as exactly that, waiting for Friday’s confirmation and trading defined-risk levels (the 84.29 hold, dip-buys at 83.04 and 82.08) rather than the headline.
Unprofitable traders do the opposite: it reads ~80,000 net long as “room to run” and chases the $85 spike, not registering that the number was taken before the catalyst.
In a market where the data lags the tape by a week, the edge is patience, let Friday tell you whether the longs are real.
To stay up to date with the latest Trader Positioning Data, visit the MarketFramework Positioning Edge Tool.


