U.S. stocks fell for a second day running to start the holiday-shortened week, as a fresh round of American strikes on Iran pushed oil back toward $100 and put inflation and the Federal Reserve squarely back in the frame.
The Dow did the worst of it, tumbling 628 points (1.18%) to 52,786. The S&P 500 fell 0.58% to 7,674 and the Nasdaq slipped to 29,525, both notching back-to-back losses.
Only one corner of the market stayed green: chipmakers.
The Oil War Goes After Iran’s Lifeline
The selling had one clear source: crude. West Texas Intermediate rose for a sixth straight day, its longest run since March and Brent settled up about 1% near $97.9 before pushing to $99 after the bell.
The trigger was a new US move against Iran. American forces struck near Kharg Island and the port of Jask, hitting Iranian oil tankers as part of a campaign to squeeze Tehran’s economy and force an end to the war, according to U.S. officials cited by Fox News and Bloomberg; Iran’s Tasnim agency reported a tanker hit close to Kharg.
That matters because Kharg handles roughly 90% of Iran’s crude exports, it is the country’s oil lifeline and satellite trackers say around 20 laden Iranian tankers are stuck near it, unable to leave through a US naval blockade.
The bigger risk now is what Iran does back. The Revolutionary Guard (IRGC) has claimed it already struck US vessels which Washington has not confirmed and a senior Iranian security official has floated a new “restricted zone” just outside the Strait of Hormuz.
For markets, any Iranian retaliation that threatens shipping in the Gulf would send oil higher still, which is the last thing a jittery, inflation-watching Fed wants to see.
Why Gold Fell When It “Should” Have Risen
Here is the twist worth explaining. War headlines normally send gold up, because scared money buys it as a safe haven.
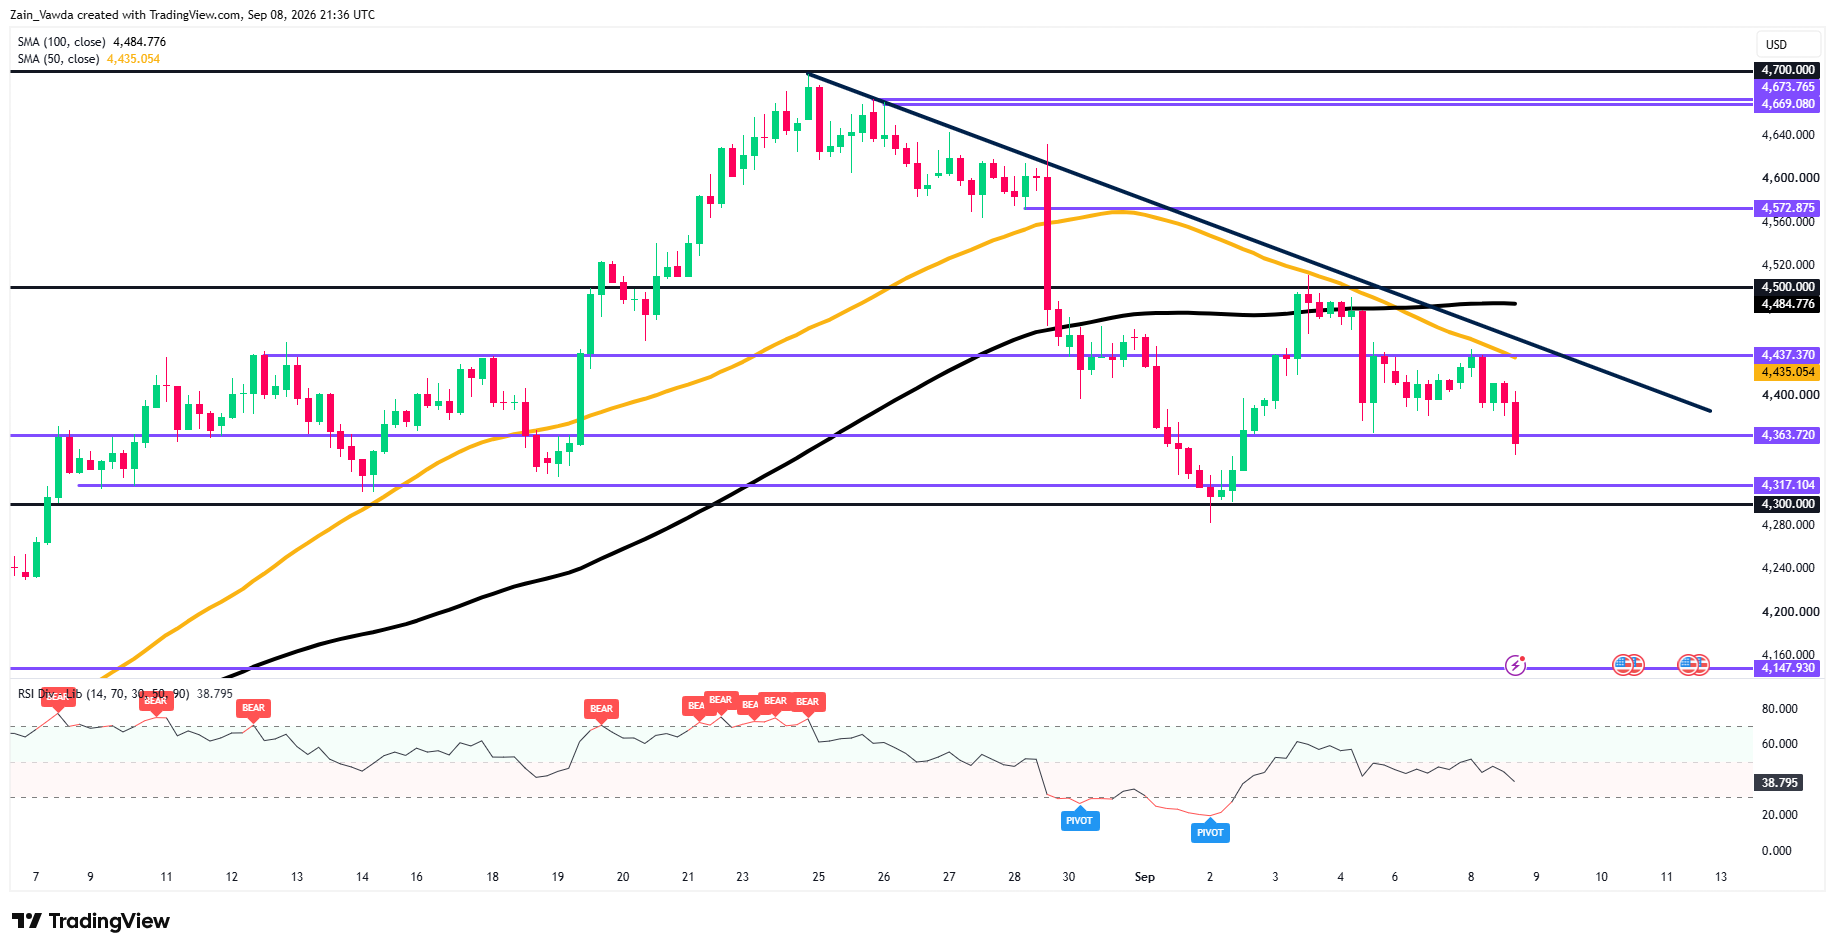
Today gold did the opposite, it slid about 1.14% to near $4,343, giving back much of August’s gains. The reason is that these strikes are aimed at Iran’s oil. So the escalation pushed crude and inflation fears higher, which pushed Treasury yields and Fed-hike bets higher.
On top of that, a campaign designed to end the war actually trims the long-term “war premium” that would normally support bullion. Both forces point the same way: down, toward the $4,300 area.
Gold Four-Hour Chart, September 8, 2026
Source: TradingView
Rates, the Fed and a CPI Cliffhanger
The oil spike went straight into the bond market. The 10-year Treasury yield sits near its highest since November 2023 and the 2-year near a January 2025 high, as traders brace for hotter inflation.
Fed funds futures now price a 59% chance of a quarter-point hike, not a cut at next week’s 15–16 September meeting.
This week’s data is the decider: producer prices land Thursday and consumer prices (CPI) Friday. As Nationwide’s Mark Hackett put it, an upside surprise on CPI would make it very hard for the Fed not to move.
Two side-stories added to the unease: Canada’s retaliatory tariffs on about $20 billion of U.S. goods took effect, reheating a U.S.–Canada trade fight, while Treasury Secretary Scott Bessent widened a buyback of older U.S. bonds to calm what he called a “fever” in the market.
The One Green Corner: Chips
Semiconductors were the day’s lone bright spot, cushioning the broader fall. The VanEck Semiconductor ETF rose about 1.2%.
Intel jumped 9.1% after a broker upgrade tied to its role in Elon Musk’s “Terafab” chip plant, AMD climbed 5.9% and Broadcom added 3%, while Qualcomm surged on a new deal to build AI chips for Amazon. It was not enough to offset the oil-driven damage, but it is why the Nasdaq fell far less than the Dow.
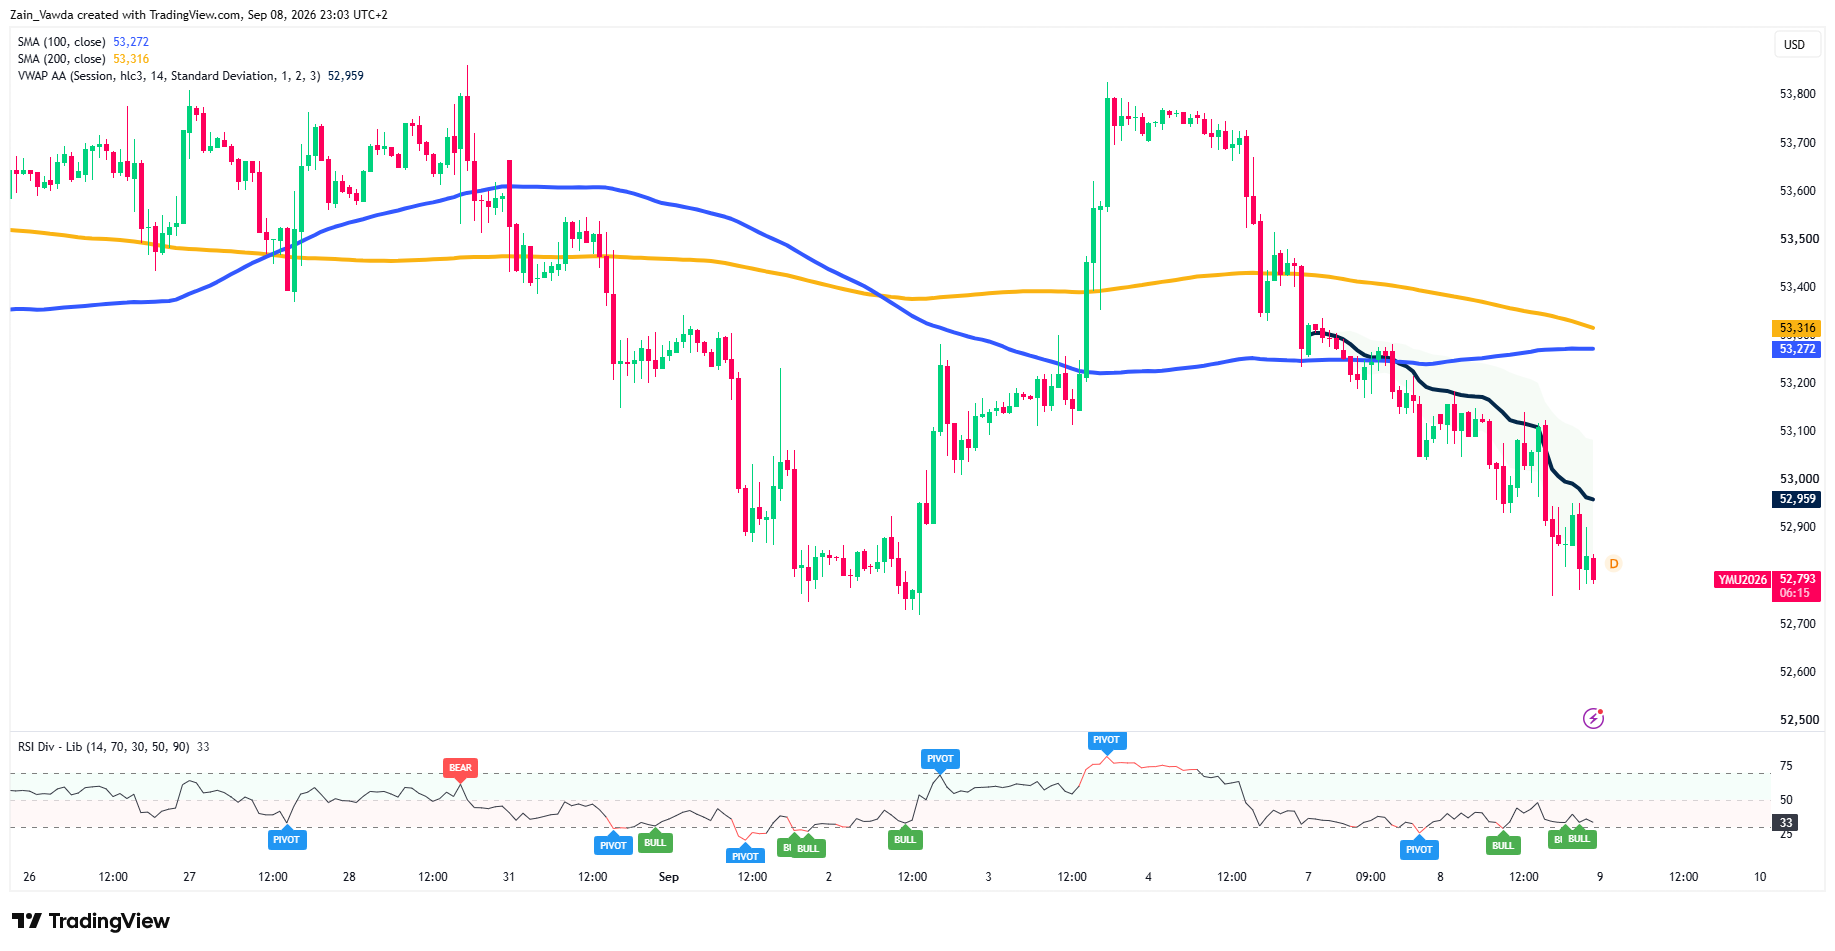
The futures charts tell the same story. Dow futures (YM) are the weakest of the majors, trading below both their 100- and 200-hour averages and below the session’s volume-weighted average price, with momentum weak (RSI near 33) as they carve out fresh lows.
Dow Futures One-Hour Chart, September 8, 2026
Source: TradingView
S&P 500 futures (ES) are also under their averages (RSI ~36) but look less broken. Until those averages are reclaimed, the path of least resistance stays lower, and Friday’s CPI is the event most likely to decide it.


