Crude oil traders spent the week glued to strike maps and tanker trackers. They may be watching the wrong screen.
With oil (CL) settling into a range below $72 after a whiplash week, the marginal driver of the next major move in crude is no longer in the Strait of Hormuz; it is in Tuesday's June Consumer Price Index release, due from the Bureau of Labor Statistics at 8:30 a.m. ET on July 14.
The logic is circular, and that is precisely the point. Oil drove inflation higher; inflation now drives the Fed; the Fed drives the dollar and real yields; and the dollar and real yields cap oil. The geopolitical premium has become an input into the very macro machinery that determines whether the premium can be sustained.
For futures traders, CL has quietly transformed from a supply-shock instrument into a rates-transmission instrument and Tuesday's print is where the loop either tightens or breaks.
The Week That Round-Tripped
The setup matters. On Wednesday, oil (CL1!) surged 4.4% to close at $73.52, its biggest daily gain since May after President Trump, speaking at the NATO summit, declared the end of the Iran ceasefire following fresh US strikes on more than 80 targets.
By Thursday, oil had snapped back more than 2% as vessel-tracking data suggested tankers were still transiting Hormuz and reports emerged that Tehran had reached out to negotiate. By Friday, oil was below $72, with US officials confirming technical talks were continuing.
That round-trip is the tell. Two days of live kinetic escalation could not hold a 4% rally, because the market's binding constraint is no longer barrels — it is the macro cost of the premium itself.
Every dollar added to CL flows into gasoline, into headline CPI, into Fed hike pricing, into the dollar, and straight back onto crude's ceiling.
The June CPI Print: Why 4.2% Is the Number That Matters
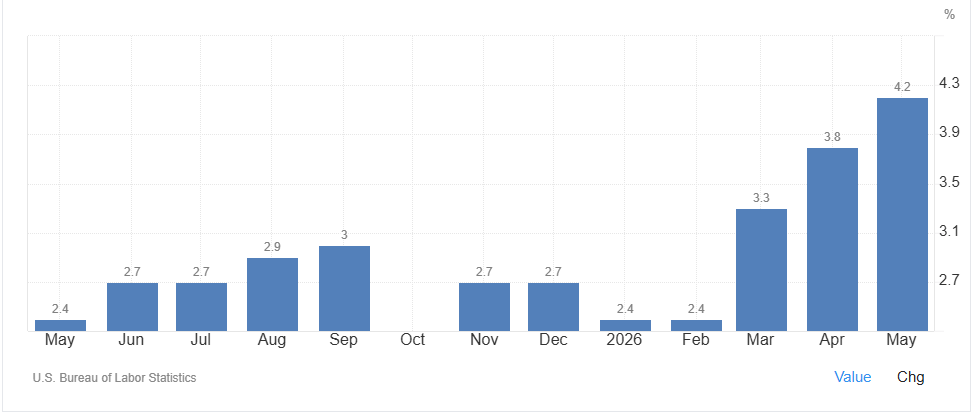
May CPI rose 0.5% on the month and 4.2% year-over-year, the largest 12-month increase since April 2023 with the acceleration driven overwhelmingly by the energy shock from the Iran conflict.
Source: TradingEconomics
The May report showed energy costs surging roughly 23.5% year-over-year, a direct pass-through of the Hormuz disruption into American pump prices. April had printed 3.8%; March and April together forced a full repricing of the Fed path.
For June, the Cleveland Fed's nowcast points to headline inflation near 4%, a deceleration from May's peak, but still double the Fed's target.
The question the market will answer at 8:31 a.m. Tuesday is not whether inflation is high. It is whether the energy-driven acceleration has peaked. June's reference period captured both the post-memorandum calm of late June and the front edge of July's renewed volatility only barely, meaning a soft print would signal that the oil shock is washing out of the data faster than feared, while a hot print would confirm second-round effects are taking hold in services and shelter.
The Fed Leg: A Committee Split Down the Middle
This CPI report lands on a Federal Reserve that is genuinely divided.
The June Summary of Economic Projections showed nine of eighteen FOMC participants projecting at least one hike before year-end, eight projecting no change, and one projecting a cut with Chair Kevin Warsh declining to submit a dot at all.
The median 2026 fed funds projection rose to 3.8% from 3.4%, and core PCE was revised up to 3.3% from 2.7% in a single quarter, the sharpest inflation markup of the cycle.
Minutes from that meeting, released Wednesday, showed only a few policymakers favored an immediate hike, though officials expressed growing concern about inflation.
Meanwhile, PCE — the Fed's preferred gauge, climbed 4.1% in the twelve months through May, its first reading above 4% in three years, and the New York Fed's June Survey of Consumer Expectations put one-year-ahead inflation expectations at 3.7%, the highest since September 2023.
Expectations are un-anchoring at the margin, and that is the input that turns a hawkish committee into a hiking one.
John Williams, President, Federal Reserve Bank of New York's framing is notable for what it omits: even as oil dominates the headline number, the New York Fed president is signaling that the committee sees demand-side pressure beyond energy.
A June print that shows core running hot alongside a moderating energy component would validate exactly that concern, and it is the single most bullish configuration for rate-hike pricing.
The consequence for CL positioning: a hot June CPI does not simply mean 'inflation up, oil up.' It means hike odds up, dollar up, real yields up — and crude's rallies sold harder.
A soft print means the opposite: the Fed leg relaxes, the dollar softens, and CL gets room to trade its own supply fundamentals again. Counterintuitively, the friendliest CPI outcome for oil bulls is a cool one.
The IEA Wedge: Cheap Crude Does Not Mean Cheap Gasoline
The IEA's July Oil Market Report, released Friday, supplies the mechanism that should worry anyone expecting crude's June collapse to show up as CPI relief.
Refined product cracks and margins surged to four-year highs in early July, as rising crude supply pushed oil prices sharply lower while product markets stayed tight, global refinery runs remain down 6 mb/d year-over-year, with Middle East export refineries yet to restart.
Headline CPI does not price crude; it prices gasoline and diesel at the pump, which is crude plus the crack. With the crack at multi-year highs, pump-price disinflation will lag the CL selloff, meaning June's energy component can print hot even though North Sea Dated plunged $22/bbl during the month, erasing all wartime gains before the July 7-8 flare-up lifted it back toward $77.
The same report frames the structural backdrop for why rallies keep getting sold: June supply rebounded a sharp 4.1 mb/d to 98.8 mb/d as Hormuz flows resumed, prompt time spreads reverted to contango, and the IEA projects supply expanding 7.5 mb/d next year if transit volumes improve — flipping the market toward surplus in 2027, contingent on de-escalation.
Oil Technical Map Into Tuesday
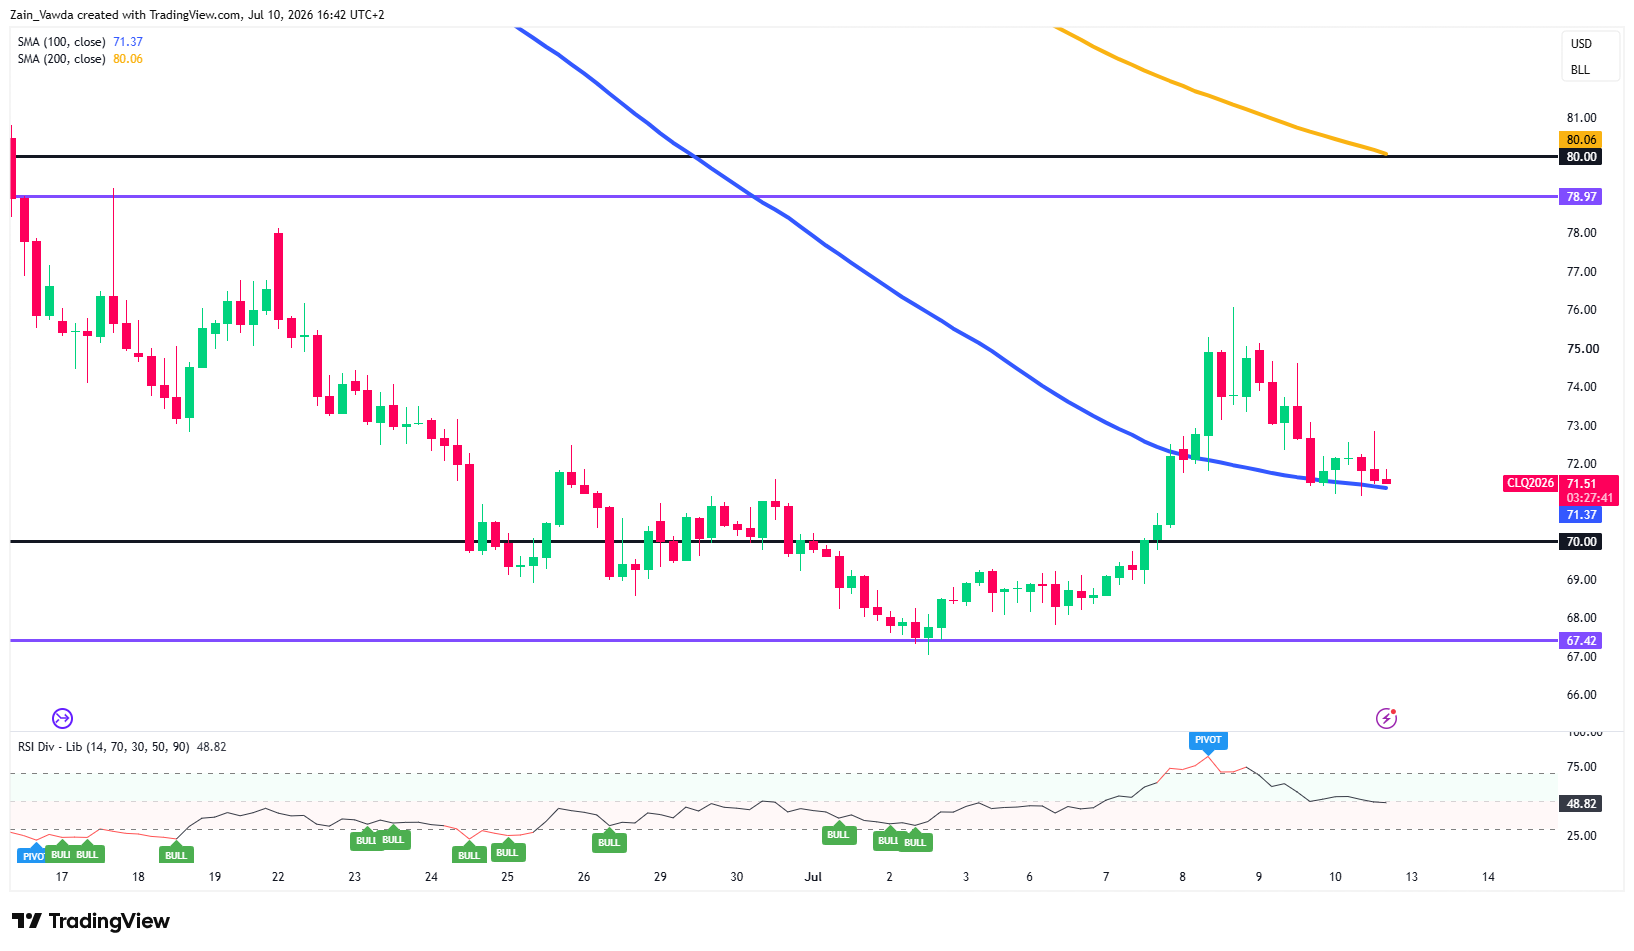
Oil has pulled back to 71.60 after Wednesday's spike to 76.00, with the retreat finding footing at the rising 100-period MA (71.62) on the intraday chart (H1), the first meaningful test of that average since the geopolitical breakout.
Oil Futures Four-Hour Chart, July 10, 2026
Source: TradingView
On the H4 timeframe, price is consolidating just above the flattening 100-day MA (71.37), which has flipped from resistance to support, while the 200-day (80.06) remains distant overhead.
The reclaimed 70.00 psychological level is now the structural line in the sand, reinforced by the daily 200-period average near 70.31 on the hourly chart.
Intraday RSI at 40 shows cooling momentum without breakdown. Holding 71.30–70.00 keeps a retest of 73.00 and 76.00 in play; losing 70.00 would signal premium unwind toward 67.42.


