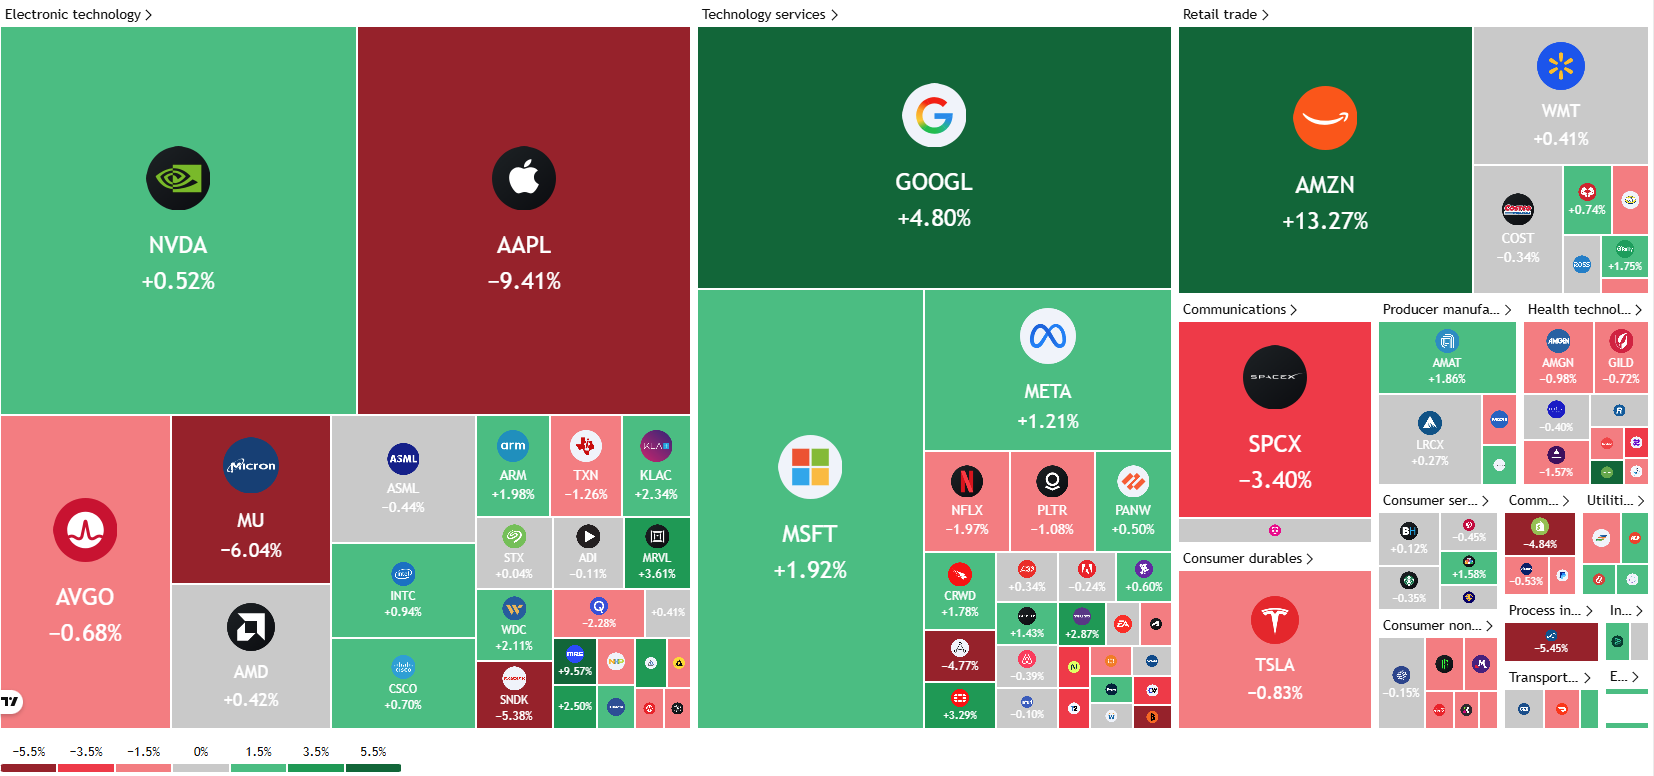
The Nasdaq 100 (NQ) has failed to hold onto pre-market and early U.S. session gains. Market participants were hopeful that a surge by Amazon may be the catalyst for a sustained move higher on Friday but the performance of Apple (-9%) was among the factors dragging the index lower ahead of the weekend.
Heatmap of the Nasdaq 100
Source: TradingView
The Nasdaq is down around 0.90% on the day but it is the intraday slide of 600 points which catches the attention. Another factor playing a role in the drop off after the U.S. open came via a rise in US yields with the US 10Y back around the 4.73% handle at the time of writing.
There has also been a rise in rate hike expectations for September which according to the CME FedWatch Tool is now at 67%, up from 63% a day ago. This is still significantly less than the odds ahead of the Fed meeting which was fully pricing in a rate hike later this year.
To make matters spicier, today’s month-end deadline forces big institutions to reshuffle their books—a routine ritual that often turns price action choppy and erratic.
The S & P 500 and Nasdaq were headed for monthly losses, while the Dow was up marginally for July.
What are the Charts Telling Us?
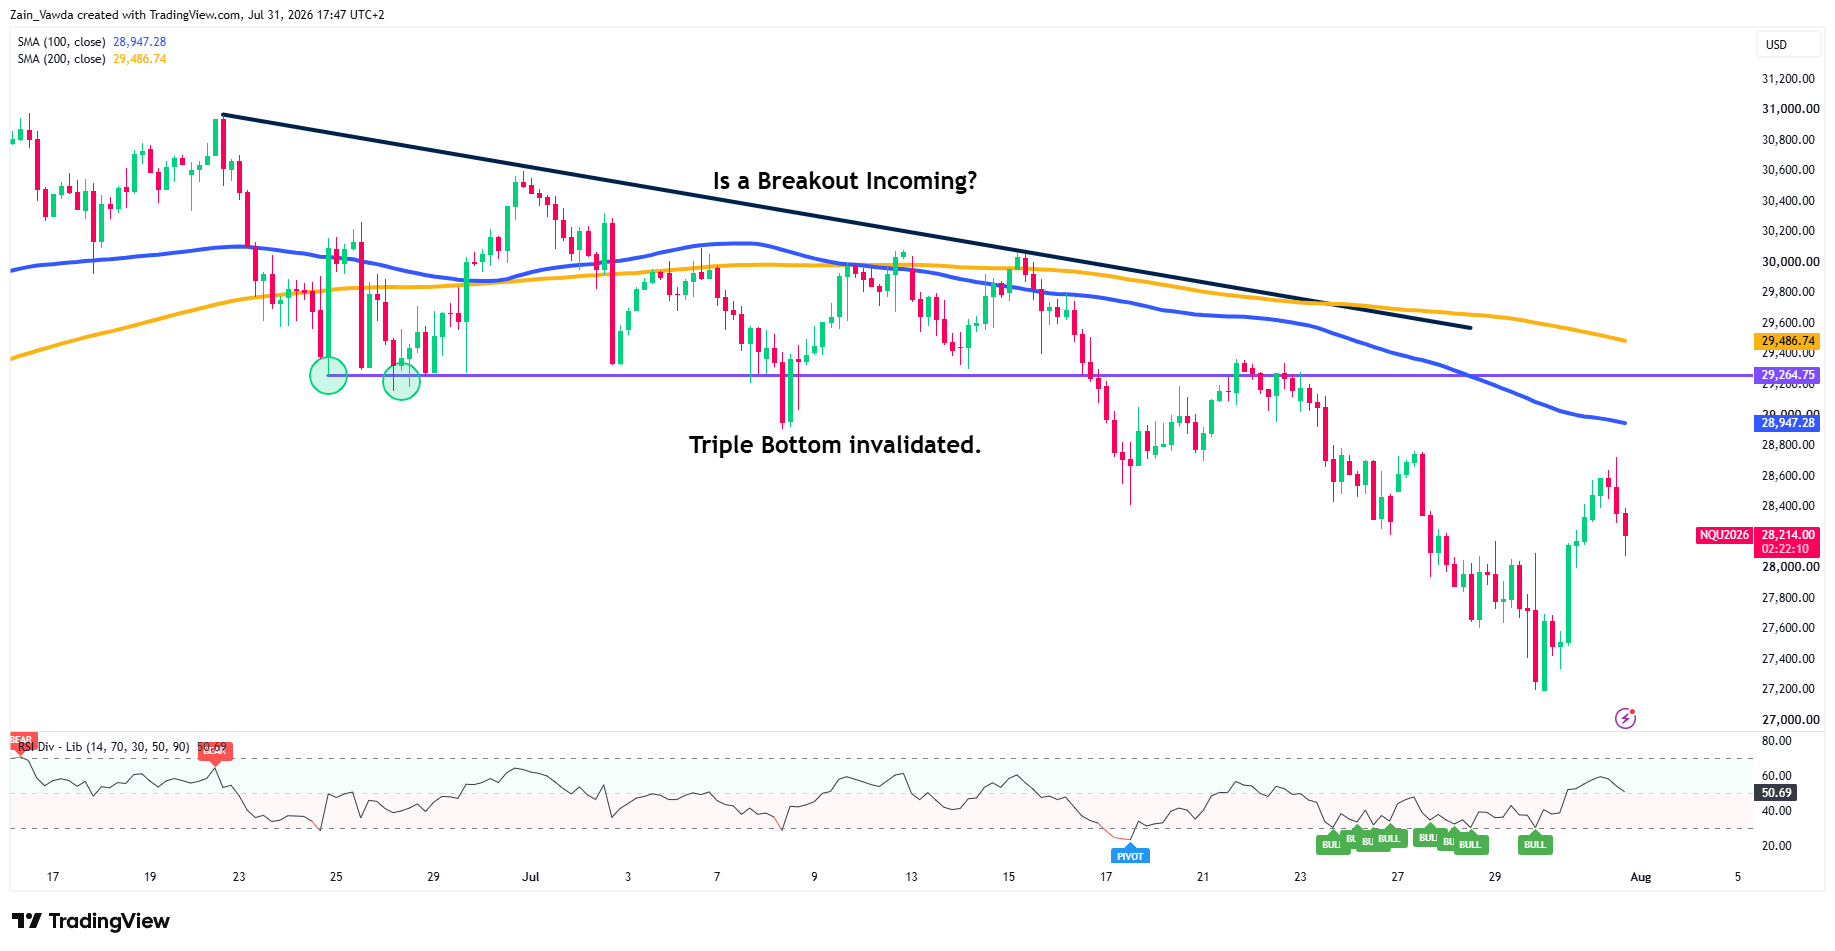
H4 Chart — downtrend intact, this is a counter-trend rally with a H4 candle close above the 28947 handle needed to confirm a change in structure.
Nasdaq (NQ) Four-Hour Chart, July 31, 2026
Source: TradingView
Price at 28,214 sits below both the 100-MA (28,947) and 200-MA (29,486), and critically the 100 is below the 200 — a bearish sequence.
RSI at 50.7 has recovered from oversold but isn't impulsive. So the V-shape off the ~27,200 swing low is a bounce into a broken structure, with a clean resistance ladder overhead: 28,947 → 29,264 → the trendline. Primary support remains the 27,200 low.
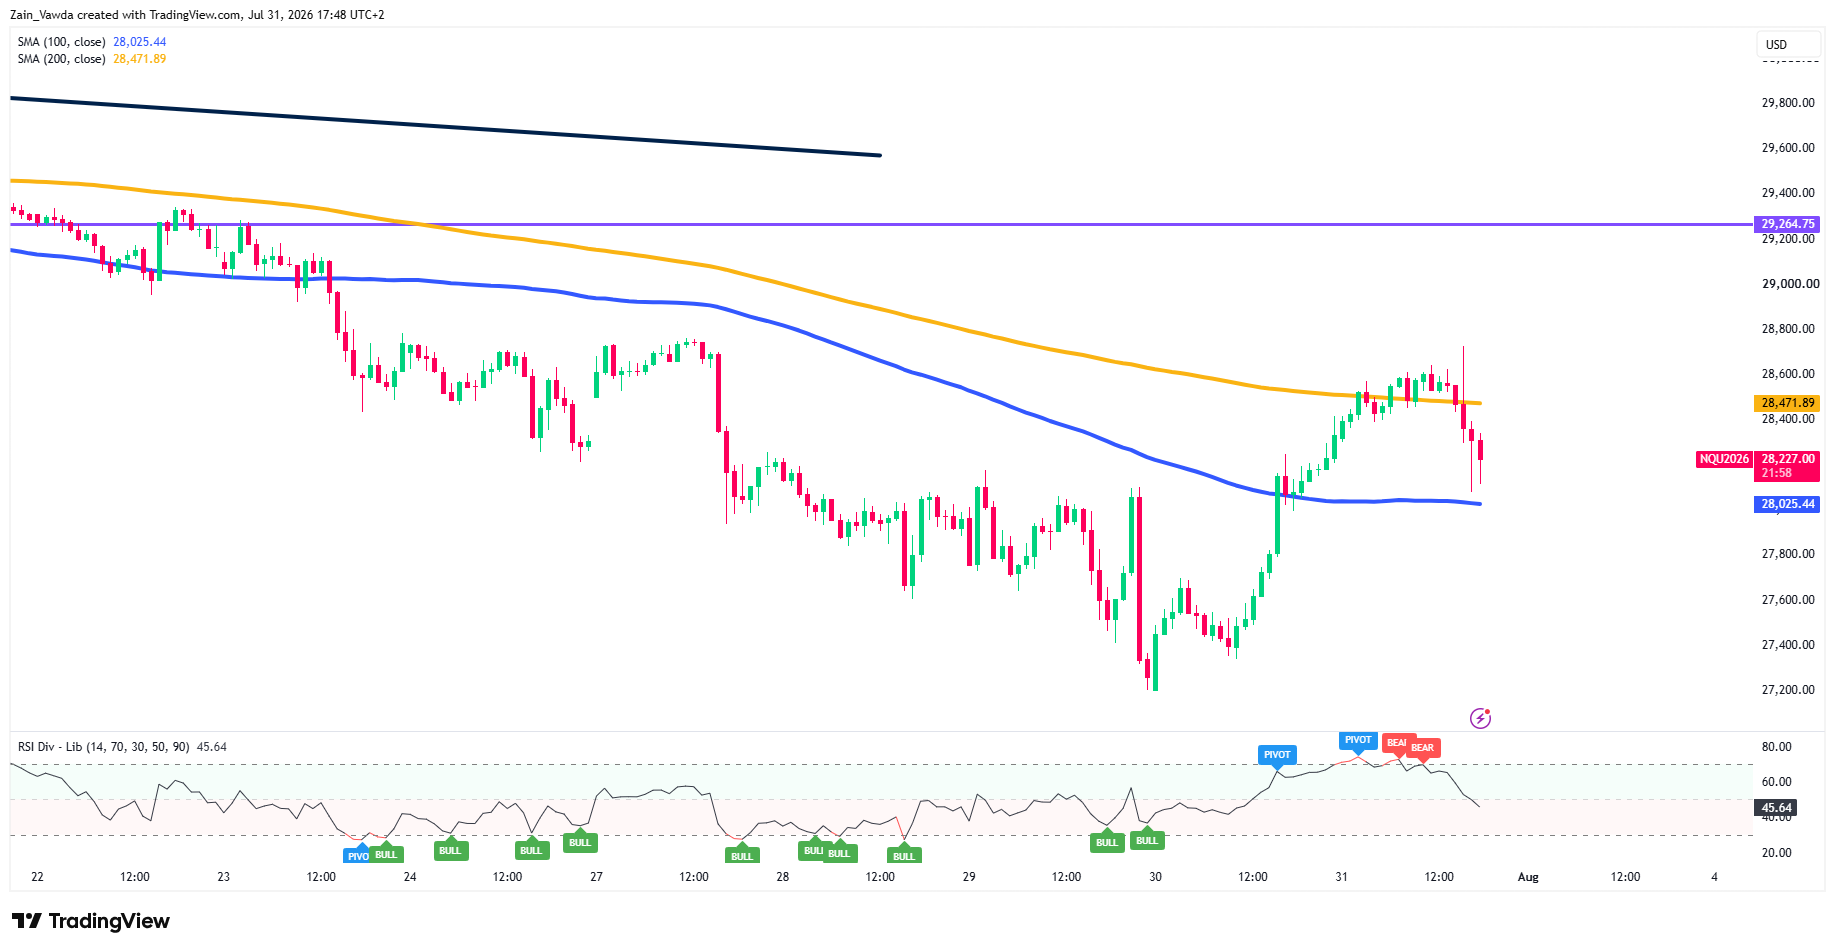
H1 — reclaimed the 100, rejected at the 200. The snapback pushed back above the 100-MA (28,025) but stalled and reversed right at the 200-MA (28,471), printing a bearish RSI divergence (the BEAR pivots near the highs) with RSI now rolling to 45.6.
Nasdaq (NQ) One-Hour Chart, July 31, 2026
Source: TradingView
That makes this the battleground timeframe: 28,025 is the floor that keeps the bounce alive, 28,471 is the lid it just failed. The rejection candle back to 28,227 says momentum is turning down from resistance.
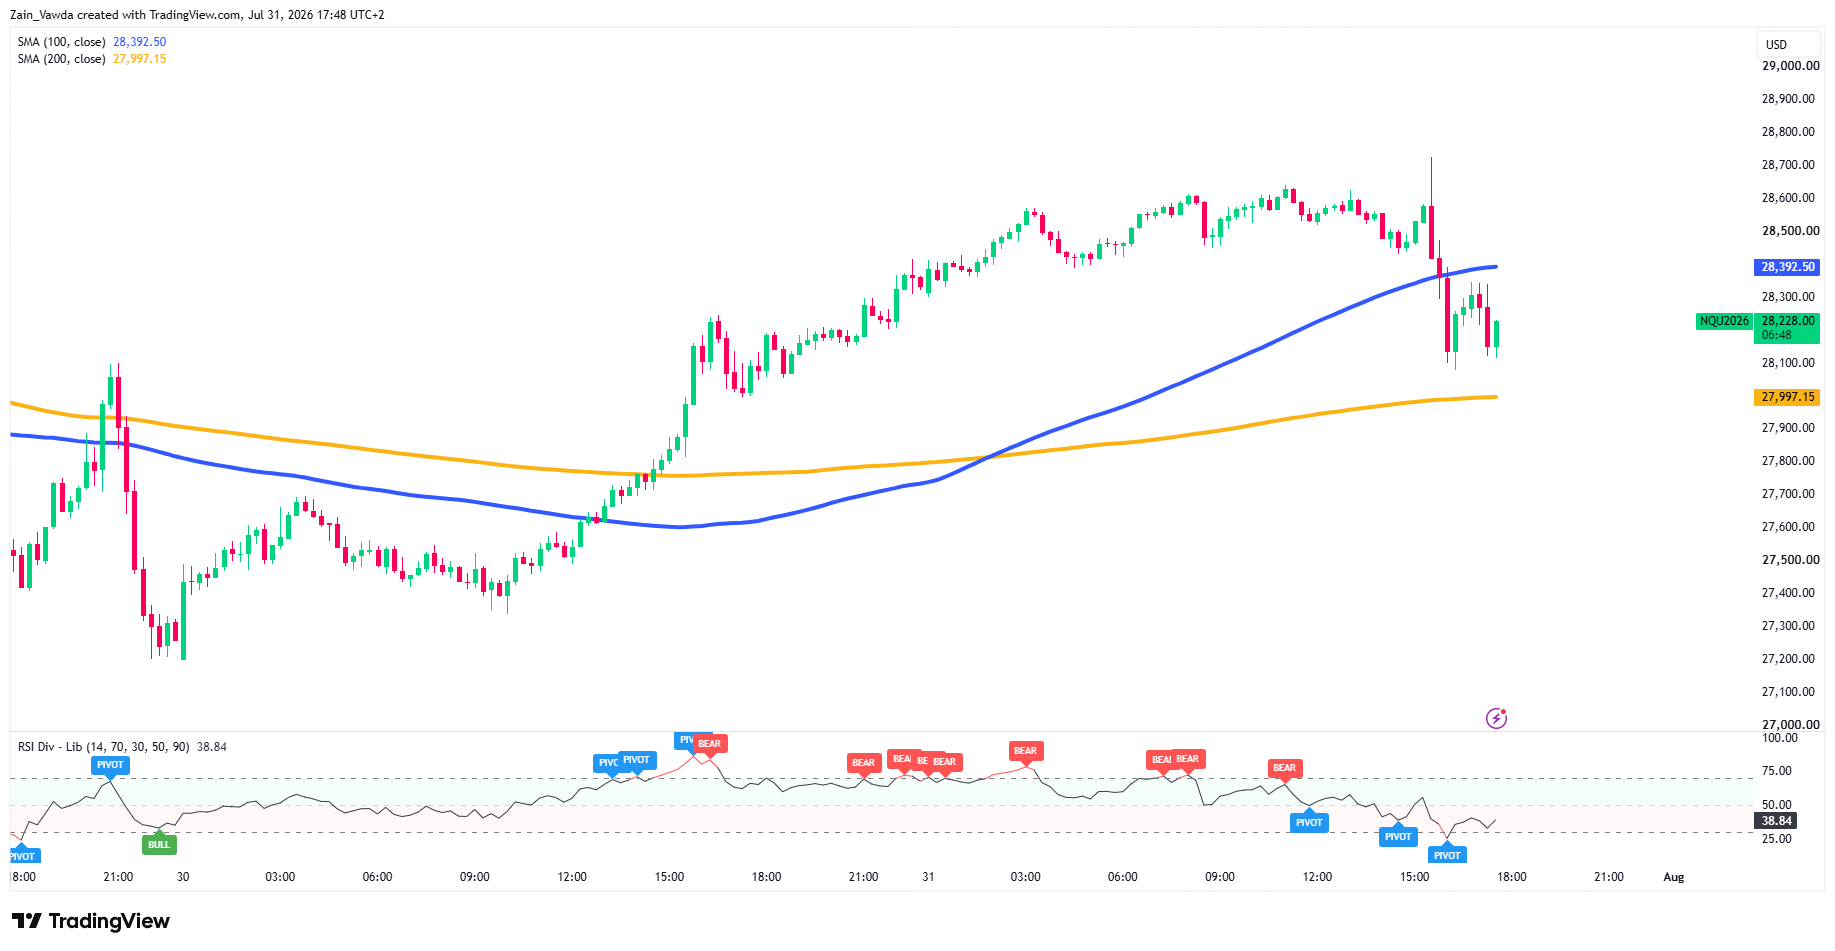
M15 — near-term corrective. Price lost the 100-MA (28,392) on that sharp rejection off ~28,700 and is now chopping just above the 200-MA (27,997), RSI weak at 38.8 with a stack of bearish pivots overhead.
Nasdaq (NQ) M15 Chart, July 31, 2026
Source: TradingView
Immediate resistance 28,392, immediate support 27,997, with an intraday floor around 28,050.
Confluence — the pocket that decides it:
Price at 28,214 is coiled almost dead-center in that ~28,000–28,470 pocket. The read stays neutral-to-corrective: this is an oversold bounce until it reclaims 28,470 on a closing basis, and it's a failed bounce the moment 28,000 gives way — which is exactly the "short-covering into month-end vs. genuine re-rating" call expressed in levels rather than narrative.
- Resistance band 28,390–28,470 — where the M15 100-MA (28,392) and H1 200-MA (28,471) overlap. This is the single most important level. Reclaim and hold it, and the bounce earns a run at 28,947.
- Support band 27,997–28,025 — where the M15 200-MA (27,997) and H1 100-MA (28,025) stack. Lose it and the snapback is done, opening 27,600 → 27,400 → 27,200.


