The Nasdaq has shed some 2.2% to retest the July 17 lows around the 28,280 mark. The index is having one of its worst sessions in a month.
Intel reports into that, after the close, with options pricing a double-digit move. The problem is not the gap tomorrow morning. It is the twenty minutes after four o'clock.
The Damage
As of 11:35 ET the Nasdaq 100 is down 2.22%, on track for its worst day in a month. The S&P 500 is down 1.44% and slipping further below its 50-day moving average. The Dow, for once the defensive trade, is off 1.1%.
The concentration is the story. A basket of Magnificent Seven names is down 5.27%, its worst session since the April 2025 tariff shock. Alphabet has shed as much as 7% after guiding 2026 capital expenditure up to $205 billion, Tesla as much as 14% on a second-quarter miss and its first negative free cash flow quarter in over 2 years.
Meta is off 4.66%, Nvidia 2.32%, Apple 1.62%.
The macro turned hostile at 08:30. Initial claims printed 187,000 against a 210,000 forecast, the lowest since 1969. Brent went through $100. The 10-year is at its highest in eighteen months.
Every one of those inputs pushes September hike pricing higher, and every one of them compresses the multiple that the AI capex trade is being financed against.
Intel Is the Wrong Catalyst on the Wrong Day
Intel reports after the close, with options pricing a 12.52% move in either direction against an average post-earnings move of 12% over the past four quarters.
Intel's own index weight is not the problem. The read-across is. The stock is up 178% year to date and has already surrendered roughly 30% from its peak in the past month, which makes it the most crowded and most fragile long in large-cap semis — and semis carry far more NDX weight than Intel does alone.
A soft foundry number does not cost the index Intel's weight. It costs the index a repricing of the entire 18A and AI-CPU thesis that has carried the sector since spring, on a day when the market has already demonstrated it will sell good results for expensive reasons.
Intel has also exceeded its options-implied move in four of its past eight reports. The band is a guide, not a boundary.
Why Flat May Be a Position Today
The instinct after a 2.2% decline is to treat it as a discount. That instinct is what the print at 16:05 is built to punish.
Because NQ trades nearly around the clock, there is no gap in the cash-equity sense; the contract will price the release in real time. What replaces the gap is worse for anyone holding size. Between the close and roughly 16:30 ET, book depth thins sharply at exactly the moment the largest single-name catalyst of the day hits the tape. Slippage in that window is not a rounding error, and a resting stop does not protect a position through it.
The distinction matters for sizing. Overnight NQ length today is not a directional bet on Intel. It is a bet on liquidity being available at the moment you most need it, which is the one bet the tape rarely honours.
SCENARIO MATRIX · NEAREST CATALYST: INTEL Q2, AFTER THE CLOSE
| Case | Trigger | Nasdaq Implications |
|---|---|---|
| Bull | Revenue above $14.4bn, 18A external foundry revenue confirmed, gross margin holds near 39%. | INTC squeezes toward the $107-109 EMA cluster. Semis catch a relief bid overnight, NDX defends 28,200 and eyes 29,000 and today reframes as capitulation rather than continuation. |
| Base | In-line revenue and EPS, cautious or unquantified foundry commentary. | INTC moves inside the 12.52% implied band. NQ chops through the globex session without resolving. 28,200 survives into Friday's flash PMIs as the line. |
| Bear | Revenue miss, gross margin below 39%, or vague 18A yield and customer commentary. | INTC exceeds its implied move to the downside, as it has in four of its past eight reports. Semis reprice, 28,200 fails overnight, and the triangle measured move toward 26,900 comes live. |
The index does appear to have found support for now at the July 17 lows at 28,280, rallying around 280 points to trade at the 28,560 handle.
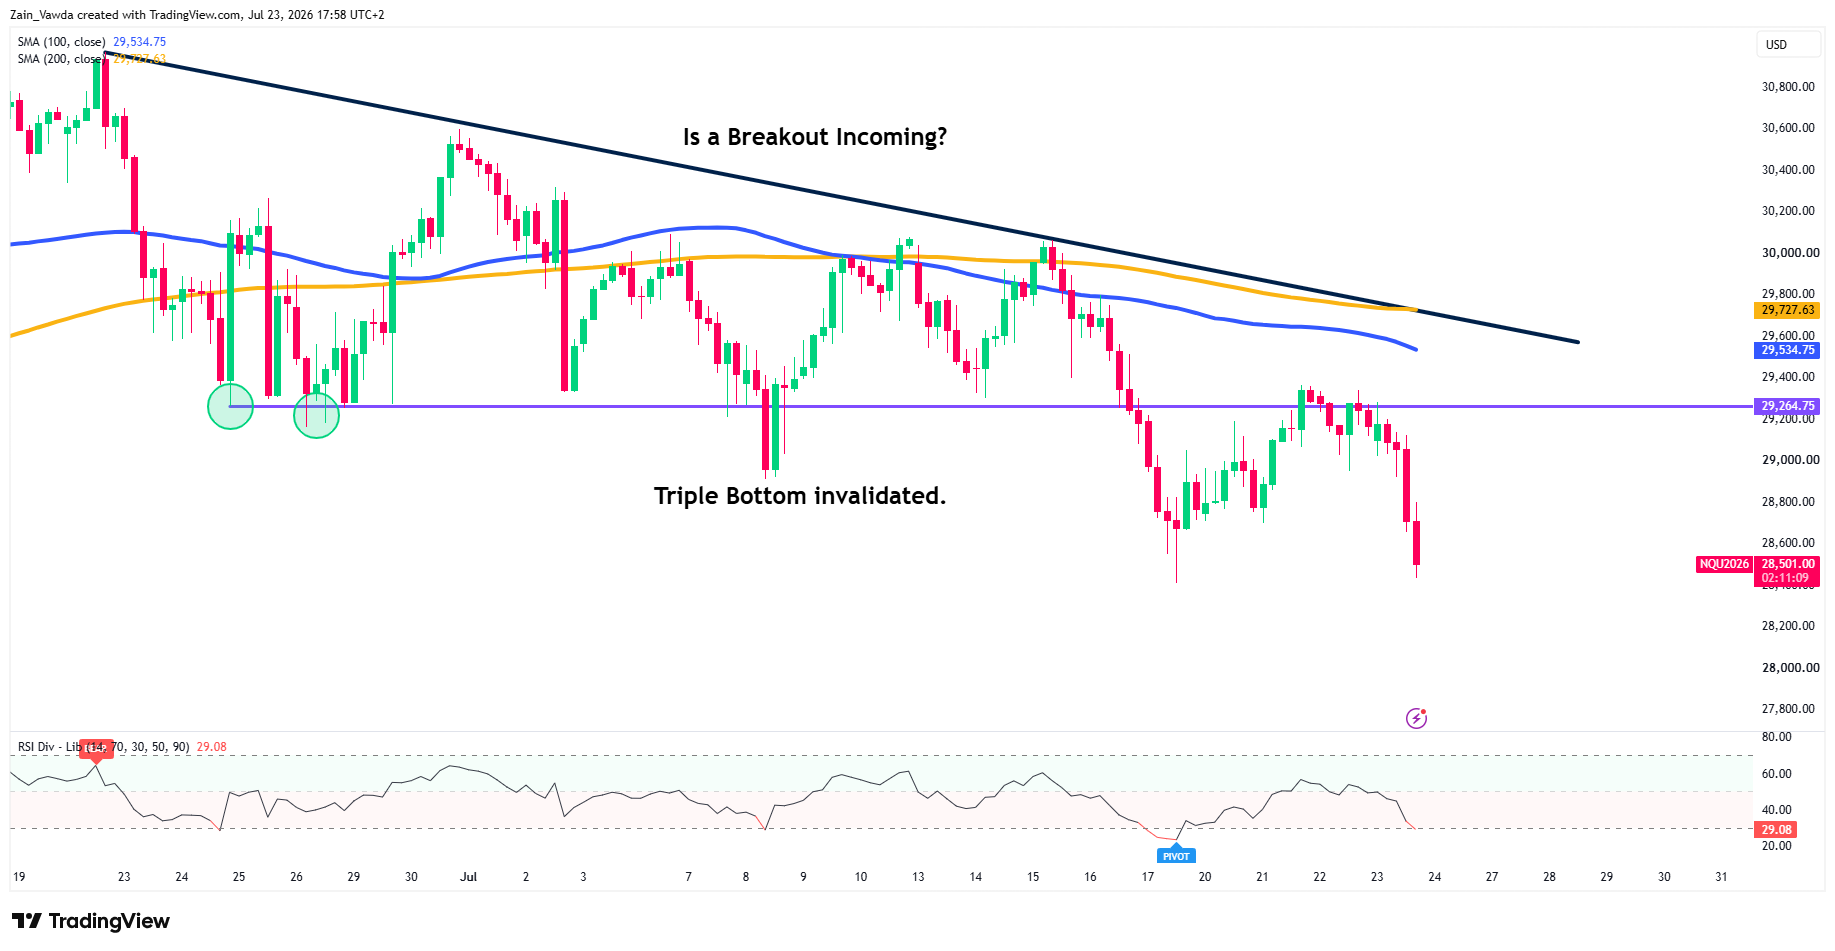
Nasdaq Four-Hour Chart, July 23, 2026
Source: TradingView
The descending trendline from 31,000 remains intact, and both moving averages sit far overhead: the 100-MA at 29,534.75 and 200-MA at 29,727.63, still sloping lower.
RSI at 29.08 has pushed into oversold territory, which raises the odds of a technical bounce but offers no divergence signal — momentum is confirming the move, not fading it.
Downside focus shifts to the July 17 low near 28,430. A break there opens 28,200. Any relief rally faces immediate supply at 29,264.


