
Nasdaq-100 futures held 28,631.75 through Friday’s European session, up 11.00 points, or 0.04%. That is a flat tape. It follows a session in which the cash Nasdaq-100 fell 1.9%, and the seven largest names in the index shed roughly $797 billion between them — their worst single day since the April 2025 tariff rout.
The US session has seen the Nasdaq slide 300 points at one point in the session with the 28,000 handle for the cash Nasdaq coming under threat. The index has recouped some of the losses and yet trades sharply lower.
Nasdaq Futures Hits 6-Week Lows
The Composite’s break of 25,000 is the number the wires are running with. For anyone trading the contract, it is the wrong one.
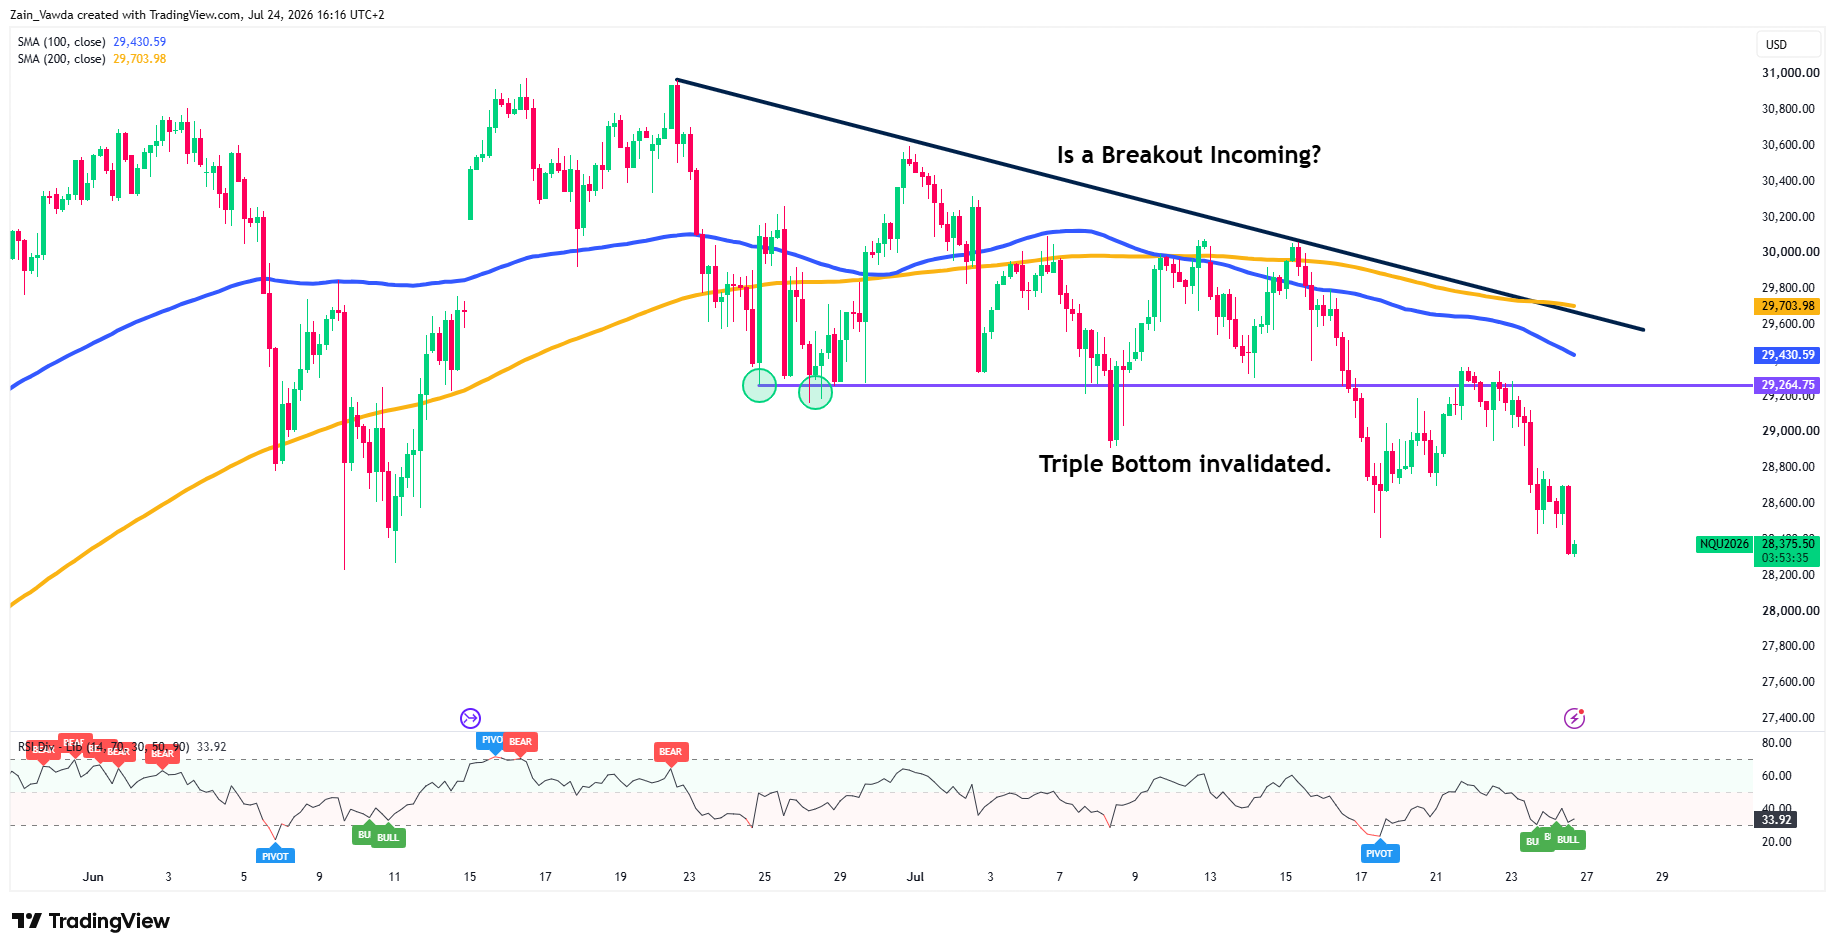
NQ Futures confirmed a triangle breakdown on July 16, settling at 28,707.50 after trading as low as 28,408. That triangle had formed since mid-June beneath the early-June high near 31,050, and its measured height — roughly 2,500 points — projects toward 26,800–26,900.
Nasdaq Four-Hour Chart, July 24, 2026
Source: TradingView
The 200-day moving average sits at 26,918. The measured move and the long-term trend line arrive in the same 100-point pocket. That convergence is not common, and it is worth respecting.
Friday’s print sits below the July 16 settle and roughly 82 points above the July 16 low. Price has spent eight sessions failing to reclaim the breakdown and is now back at the pivot with lower highs behind it.
The counter-trend bounce is spent. The only question that matters into the weekly close is whether 28,550 survives a second test.
Why the Index Went Nowhere While its Constituents Did Not… WIll This Continue?
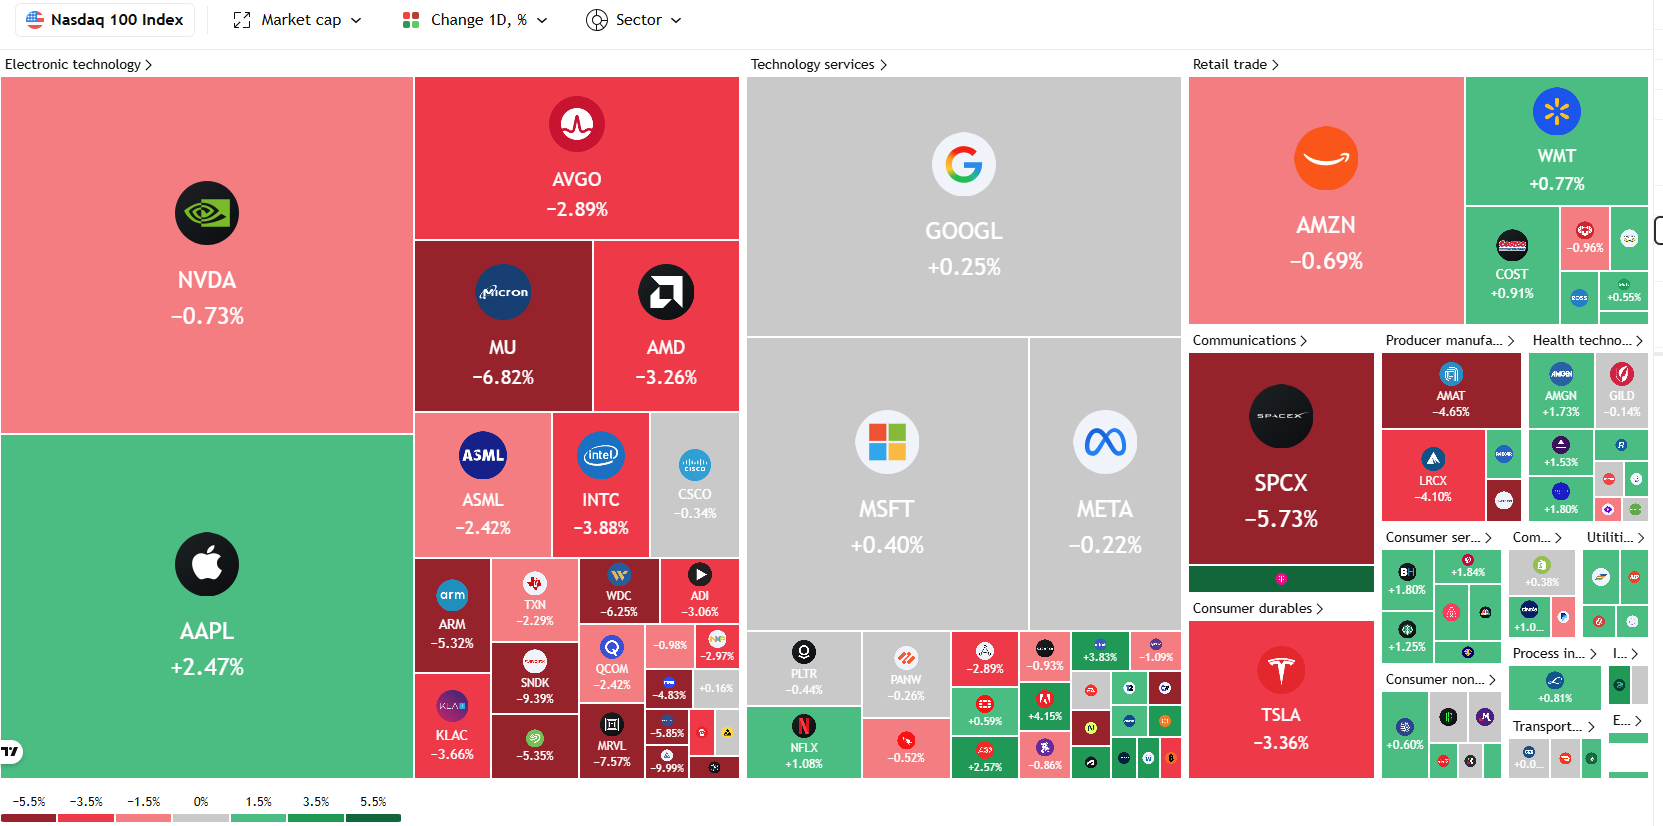
The story of the session yesterday and the struggles of the Nasdaq is capital is rotating out of the payers of AI capex and into the receivers of it.
Both sit inside NQ — but the payers carry the heavier weights, which is why the index fell while the rotation beneath it was closer to neutral. JPMorgan strategists have flagged the same divergence as an echo of the late 1990s and called the coming weeks decisive.
The question for traders is whether this will impact the rest of Friday's session as well.
Outlook Into the Weekend
The Nasdaq sold off after the US open but did get a brief reprieve that to positive US PMI data.
Nasdaq 100 Heatmap
Source: TradingView
The US Composite PMI hit 53.6, fueled by a booming services sector despite slowing manufacturing. This growth sparked renewed hiring and boosted business confidence to an 8-month high.
However, Middle East conflicts severely worsened supply chain delays, driving both input costs and selling prices to multi-month highs.
The question into the weekend is whether the cash Nasdaq will breach the 28,000 psychological handle. This could be the first sign of growing structural concerns with some big earnings releases still to come.
Add to that another weekend of uncertainty on the US-Iran front and market participants may opt to remain cautious.
Looking at the Positioning Tool data on trader positioning, NQ displays a "mild bearish divergence."
Profitable traders are currently net short (48% long), while unprofitable traders are net long (53% long). Since successful traders are 5% more short than losing ones, market participants may glean this as a bearish signal, suggesting that the "smart money" is anticipating a downward move in tech.


