
The session so far: an oil-and-yields sell-off
The Nasdaq 100 (NDX) is the weakest of the major U.S. indices today, and the pressure is coming from outside the stock market.
U.S crude (WTI) pushed back above $100 a barrel and Brent above $105, and that lit a fresh inflation scare. The 10-year Treasury yield jumped above 4.9%, its highest since November 2023 and higher rates hit the high-growth, high-beta names hardest. The chip leaders that drove the bull run turned lower, with Intel off about 3% and Micron about 2%.
Of the cash indices, the Dow, Nasdaq Composite and the S&P 500 indices are down roughly 0.4% each.
The morning's data didn't help. Wholesale inflation (August PPI) rose 0.4% on the month, in line with forecasts but that still leaves the annual rate at 5.4% with concerns that inflation pressure in the pipeline may soon be felt in the CPI print as well.
As 21shares' Stephen Coltman put it, the report didn't settle the “hike or hold” question for next week, and with oil back over $100 and yields at new highs, the stakes into tomorrow's CPI just went up. Fed funds futures now price about a 70% chance of a quarter-point Fed hike on Sept. 16.
For the rest of today, that backdrop means rallies are likely to be sold unless oil and yields back off.
Reading the Three Intraday Timeframes (H1, M30, M15)
All three charts tell the same story from different distances.
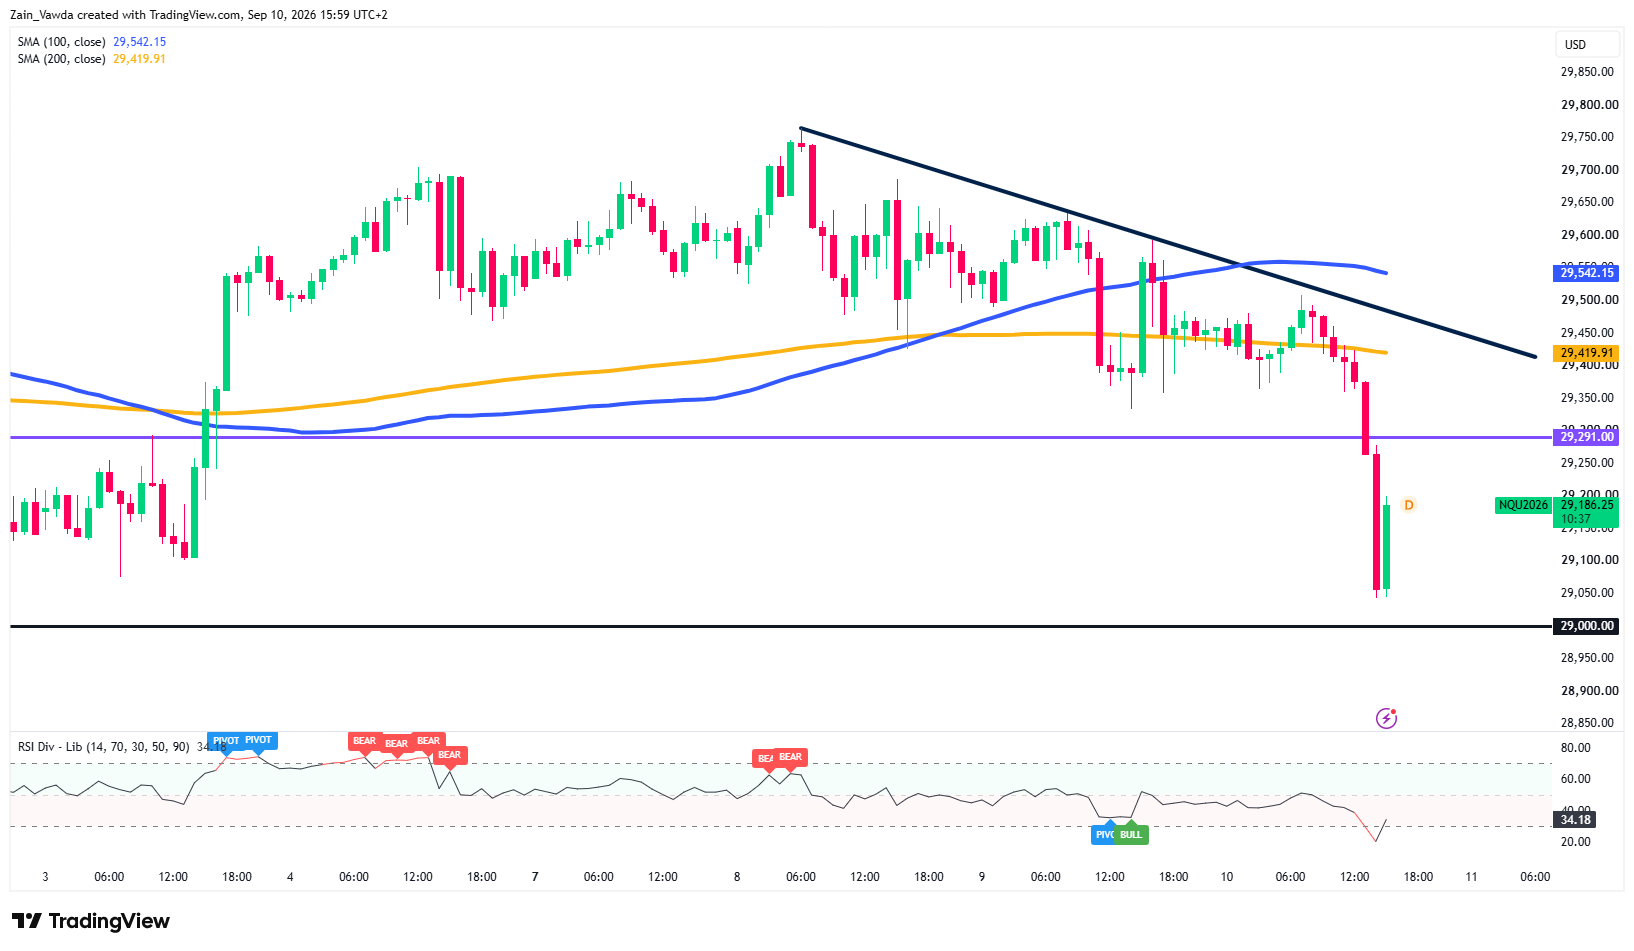
On the H1, price has broken its early-September uptrend and trades well below both moving averages, which are rolling over and about to cross lower.
Nasdaq (NQ) One-Hour Chart, September 10, 2026
Source: TradingView
On the M30, that bearish cross has already happened — the 100-average (29,484) sits below the 200-average (29,542), with price far beneath both.
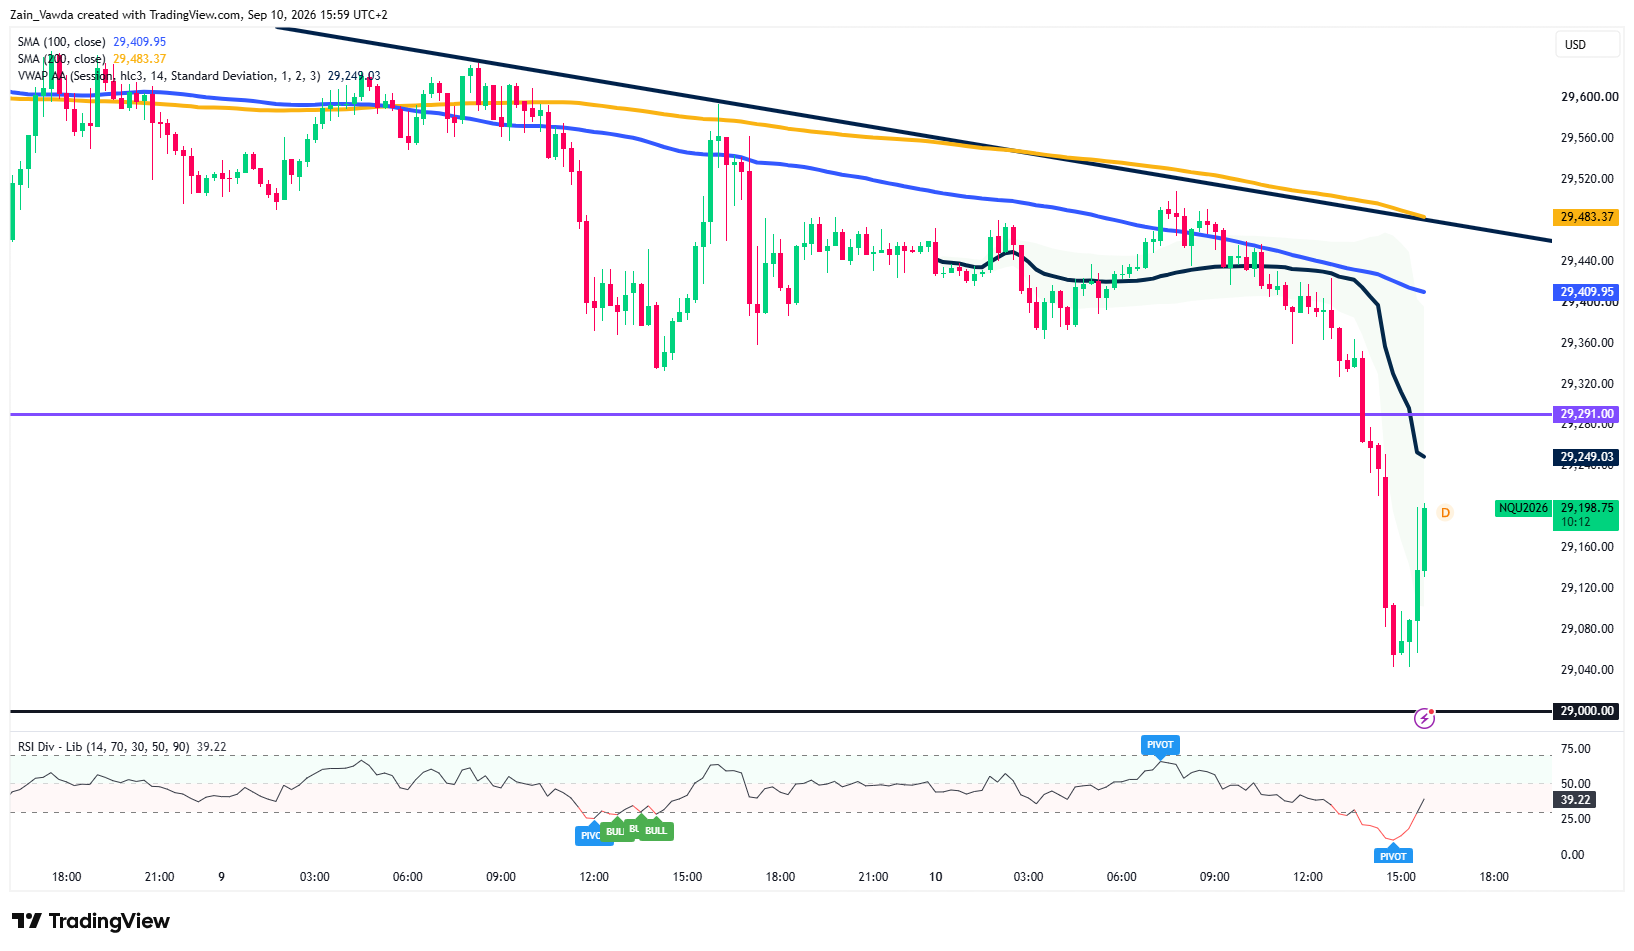
Zoom into the M15 and you see today's damage in detail: a clean waterfall through the 29,291 shelf down to about 29,040, then a sharp but shaky bounce back toward 29,190.
Nasdaq (NQ) M15 Chart, September 10, 2026
Source: TradingView
Price is still under the session VWAP at 29,249, and momentum (RSI in the mid-30s on every timeframe) has only just turned up from an oversold low which is likely an intraday bounce, not yet a trend change.
The Level That Matters: 29,291
The 29,291 line shows up on every timeframe. It was support all week; today NQ fell through it, so it flips into the first ceiling the bulls must win back.
Just under it sit the old desk pivot at 29,264.75 and the session VWAP at 29,249, together they form an immediate wall of resistance right above the current price.
If sellers defend that zone, the path of least resistance stays down into tomorrow's CPI.
Where NQ Could Go For The Rest of the US Session
| Scenario | Trigger | Nasdaq Path |
|---|---|---|
| Bull (Squeeze) | Oil/yields ease; NQ reclaims 29,249 then 29,291 | Short-covering toward 29,410–29,440 |
| Base (Sell the rip) | Bounce fades at 29,249–29,291; de-risking into CPI | Chop 29,100–29,291, drift lower into the close |
| Bear (Breakdown) | Rejected at resistance, loses 29,120 | Retest 29,040 → then 29,000 |
Trader Positioning Data
The latest Positioning Tool Data on MarketFramework shows NQ is trading down 1.10% at 29,171, displaying a mild bearish divergence.
While both groups hold net-long positions with the same average long entry price of 29,141.53, profitable traders are taking a more defensive stance.
Overall, more successful traders are aligning better with the market's downward momentum at present.


