
The S&P 500 enters the second half of 2026 with a rare convergence of historically bullish signals: a quantitative Bull & Bear Indicator reading in favor of further upside (Short-term), recession probabilities stabilizing, a midyear year-to-date (YTD) return profile that has historically resolved higher over 93% of the time, and July seasonality that is one of the strongest months on the calendar.
Against that backdrop, the macro risks are real, a hawkish Fed, a compressed NFP week, and geopolitical wildcards. The question for futures traders is not whether the bull case exists. It clearly does. The question is whether any of the risks can derail the rally?
The Midyear Setup: History Heavily Favors the Bulls
Entering July 1, the S&P 500 is up approximately 7% year-to-date, firmly within the 5–10% YTD gain bracket at the midpoint of the year.
According to Carson Investment Research data, when the index has been up between 5% and 10% at mid-year since 1950, it has gone on to finish the full year higher in 93.8% of cases, with an average gain of nearly 14%
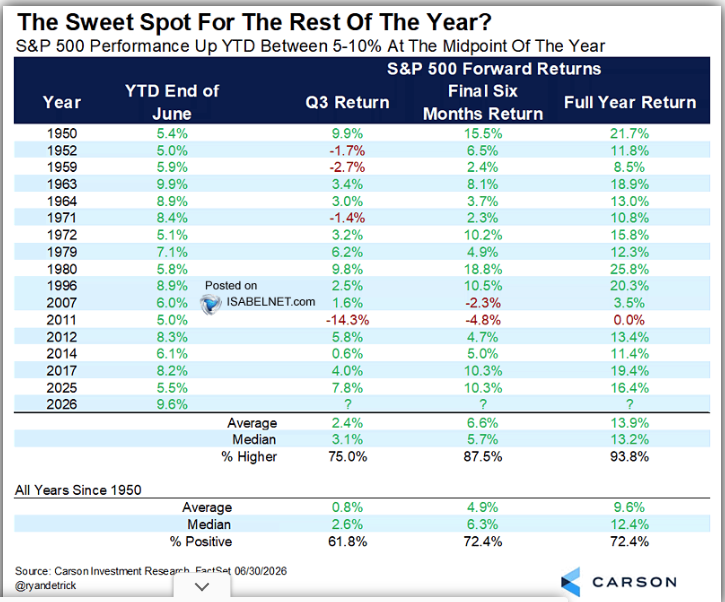
Source: Carson Investment Research, Isabelnet.
That is not a marginal edge, it is one of the strongest conditional probabilities in the historical return dataset.
The mechanism is straightforward: a market that has already delivered positive returns in H1 without catastrophic macro deterioration tends to be one with sufficient fundamental and liquidity support to extend. The current setup checks those boxes — resilient labor market, no recession signal, AI capex cycle intact, and JOLTS job openings at a two-year high. The bull case is historically grounded, not just sentiment-driven.
Recession Probability: Effectively Zero
The St. Louis Fed's Smoothed U.S. Recession Probability model, which applies a dynamic-factor Markov-switching approach to four coincident variables (real personal income ex-transfers, industrial production, non-farm payroll employment, and real manufacturing & trade sales) currently reads 0.44%.
The critical threshold for this model is 5%: historically, once the reading crosses that level, recession risk increases significantly. At 0.44%, it is hovering close to previous lows. For futures traders, this is the single most important macro backstop underpinning the bull thesis. You cannot sustain a bear market without recession risk, and recession risk is essentially absent by this measure.
The Bull & Bear Indicator: Aligned With the Upside
The ISABELNET Stock Market Bull & Bear Indicator, a contrarian multi-factor model updated daily is currently registering a bullish signal for U.S. equities. The model has produced an average return per trade of 3.88% with a 90% success rate across tactical long-only signals from 2011 to 2026.
When this indicator has been bullish at the open, the market has historically delivered. It does not override macro risk, but it does confirm that the near-term weight of evidence sits with the bulls not against them.
July Seasonality: The Calendar Is an Ally
Having just exited June, historically one of the more challenging months of the year, particularly in midterm and non-election years, with softer average returns and choppier intra-month swings.
The S&P 500 now enters July, which is seasonally one of the stronger months on the calendar. Topdown Charts and LSEG seasonality data shows July has historically delivered average monthly returns of 0.8% dating back to 1964 for the S&P 500.
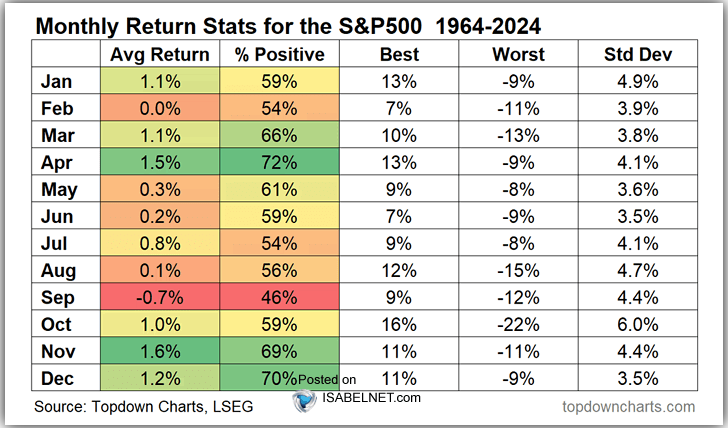
Source: Topdown Charts, LSEG Data
The Q2 earnings season begins mid-July, which has historically added a further tailwind as strong corporate guidance reinforces the growth narrative.
The Risks
If the NFP data comes in hot this week and inflation remains elevated this could throw a spanner on the works for the potential bullish rally. However, the recent hawkish repricing of rate hike probabilities did not do a lot to scupper the rally.
Another factor which could come into play is the earnings season. Mega-cap tech will need to continue to outperform or we could see a pullback as markets reevaluate lofty expenditures and significant Capex moving forward.
The Bottom Line
S&P 500 (ES) Futures Four-Hour Chart, July 1, 2026
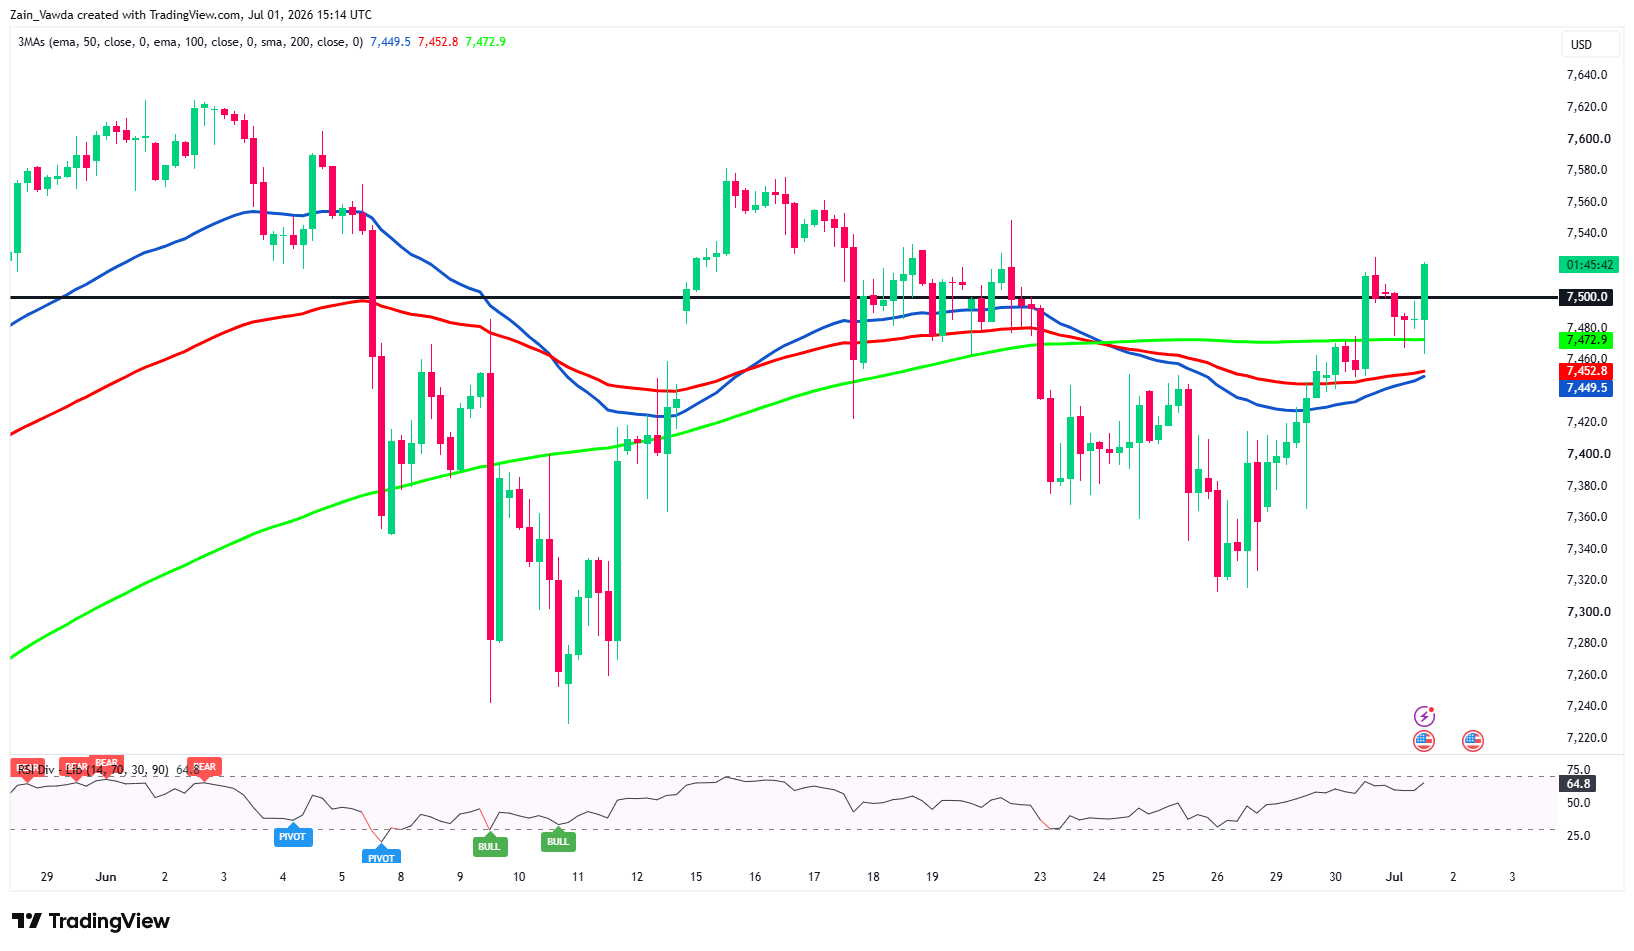
Source: TradingView
The SPX500 four-hour chart displays robust short-term bullish momentum as the price has held above the 7,500 handle.
Rebounding sharply from late-June lows near 7,360, the index has successfully surged above its primary moving averages:100 MA, and 200 MA.
These averages are now tightly clustered in the 7,471–7,486 range, serving as a solid dynamic support zone if a minor retracement occurs.
Furthermore, the RSI indicator currently sits at 64.8, indicating strong buying pressure while still leaving some room to run before reaching overbought territory.
However, if sellers defend this ceiling at 7,598, traders should watch for a pullback to retest the newly reclaimed 200 MA support.


