
EUR/USD is posting modest gains near 1.1440 in Thursday's softer-dollar session, helped by a bigger-than-expected €19.1 billion German trade surplus for May. But the bounce is happening inside a structure both the fundamental and technical sides read as bearish.
Add this week's hawkish FOMC minutes and the pair looks caught in a vice: Europe's energy vulnerability grinding it lower from one side, a U.S. Dollar Index pressing multi-year resistance squeezing it from the other.
The Fundamental Vice: Europe Pays for Hormuz
The renewed U.S. strikes on Iran and Trump's declaration that the June memorandum is over have revived the asymmetry that has defined this pair since late February: Europe imports its energy shock, America partly produces its way through it.
Since the conflict began, the euro has weakened while European cyclical equities (Stoxx 600 futures) have persistently underperformed U.S. counterparts (Russell 2000 futures), a capital-flow signature of the region's greater exposure.
Critically, it does appear as though the ECB angle cuts against the euro even in its hawkish form: higher energy prices may raise the odds of another ECB hike later this month, but the growth hit from those same prices is likely the more powerful driver.
Rather than a single sharp plunge, the base case appears to be a gradual grind lower punctuated by bouts of volatility as headline risk whipsaws positioning in both directions.
The Dollar Side: Breakout at Multi-Year Resistance
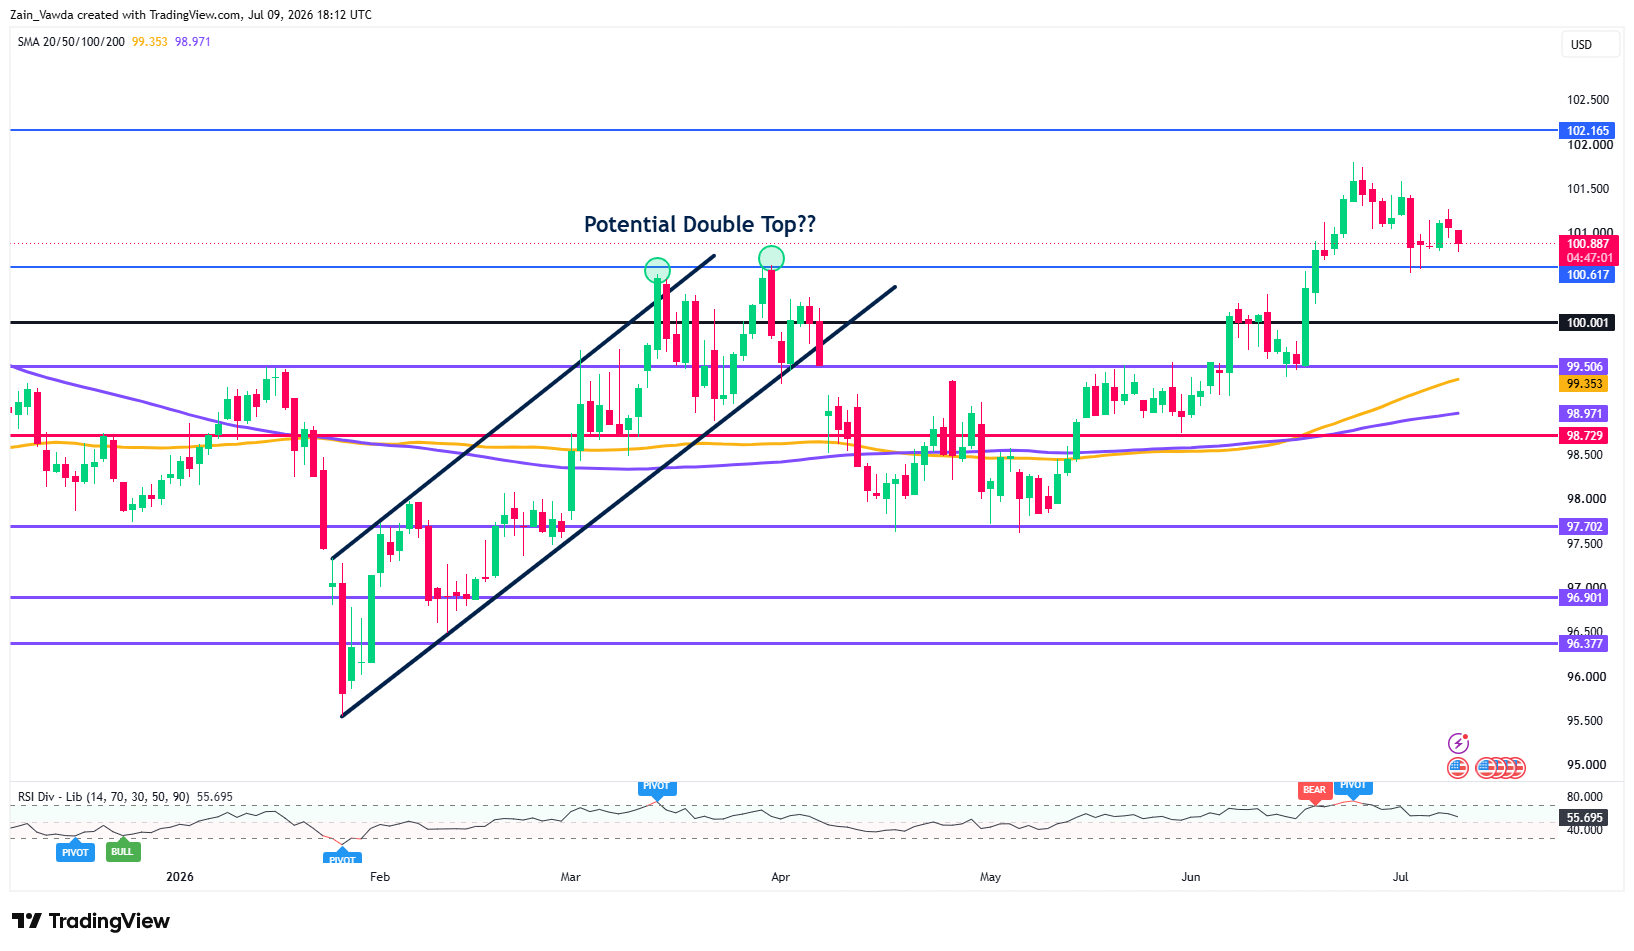
On the other side, the U.S. Dollar Index (DXY) is pressing a critical multi-year resistance zone, with the FOMC minutes and the upcoming CPI print, the events that determine whether the dollar confirms a broader bullish breakout.
Half of that test has now resolved hawkishly: Wednesday's minutes revealed some officials favoured hiking at Warsh's June debut, with most participants sketching inflation scenarios in which policy firming would be warranted.
With the euro carrying roughly 58% of DXY's weight, a confirmed dollar breakout is arithmetically a EUR/USD breakdown, making Tuesday's CPI the single most important input for EUR/USD this month.
Intraday, DXY is consolidating around 100.85, holding above Fibonacci support at 100.31.
US Dollar Index DXY Daily Chart, July 9, 2026
Source: TradingView
The Technical Map - EUR/USD
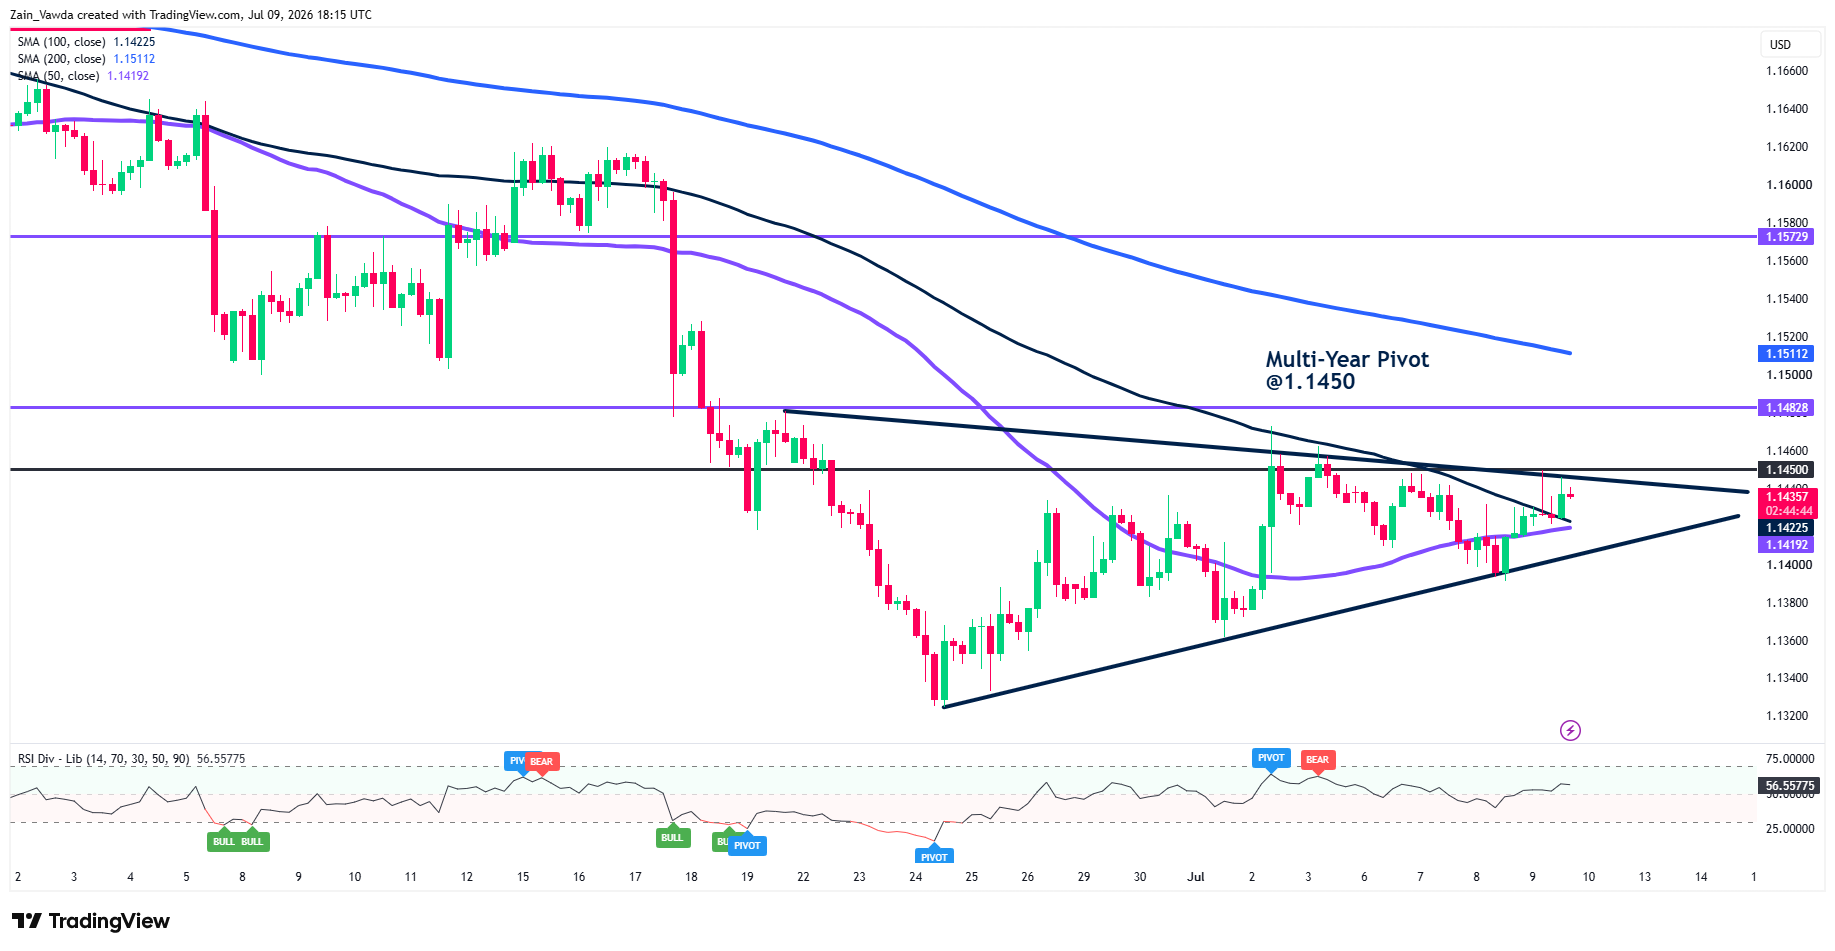
EUR/USD is coiling within a tightening symmetrical triangle, with price at 1.1436 pressing against the apex just below the multi-year pivot at 1.1450, the level that has repeatedly capped upside through late June and July.
EUR/USD Four-Hour Chart, July 9, 2026
Source: TradingView
Price has reclaimed both the 50-day (1.1419) and 100-day (1.1423) MAs, which are now converging as immediate support, while the broader downtrend from the June highs keeps the pair beneath the declining 200-day MA at 1.1511.
RSI at 56 shows momentum tilting constructive but not stretched. The triangle is nearing resolution: a decisive close above 1.1450 would target 1.1483 and then the 1.1511 region, while rejection at the pivot and a break back below 1.1419 would expose ascending trendline support near 1.1400, with a breakdown there reopening the 1.1360 area.
Compression this tight typically precedes an expansion move, the 1.1450 pivot appears to be the trigger.


