
The Dow is the tape’s outlier today. The Industrials climbed roughly 0.9% while the Nasdaq fell about 0.7% and the S&P barely held green — the cleanest expression yet of the rotation that has defined this week.
Money is bailing out of high-profile chipmakers and crowding into economically sensitive blue-chips, and the price-weighted Dow is built to catch exactly that flow.
The Dow futures trades near 53,045 as a result, printing fresh 3-week highs while the Nasdaq 100 slides toward a technical correction.
What’s Driving the Move
Three forces appear to be lifting the Dow Jones (YM).
First, blue-chip earnings: Coca-Cola powered consumer staples up ~3.7%, with healthcare and materials also higher and Sherwin-Williams adding support earlier in the week.
Second, Apple — a Dow component — is leading higher ahead of its own results, pressing toward a $5 trillion market cap.
Third, the semiconductor wreckage crushing the Nasdaq is barely represented in the 30-stock average: the SOX fell ~6% today and is down more than 20% on the month, dragged by a Korean rout (the KOSPI tripped its ninth circuit breaker of 2026; SK Hynix –14.7%, Samsung –13.4%) and an ASML slide on news of Chinese lithography competition.
Falling oil — Brent settled down nearly 9% Monday and trades down over 4% on Middle East de-escalation hopes, is pulling Treasury yields lower into the Fed, a further tailwind for the cyclical, rate-sensitive names that populate the Dow.
The caveat: all of it runs straight into Wednesday’s FOMC.
H4 — the higher timeframe just flipped bullish
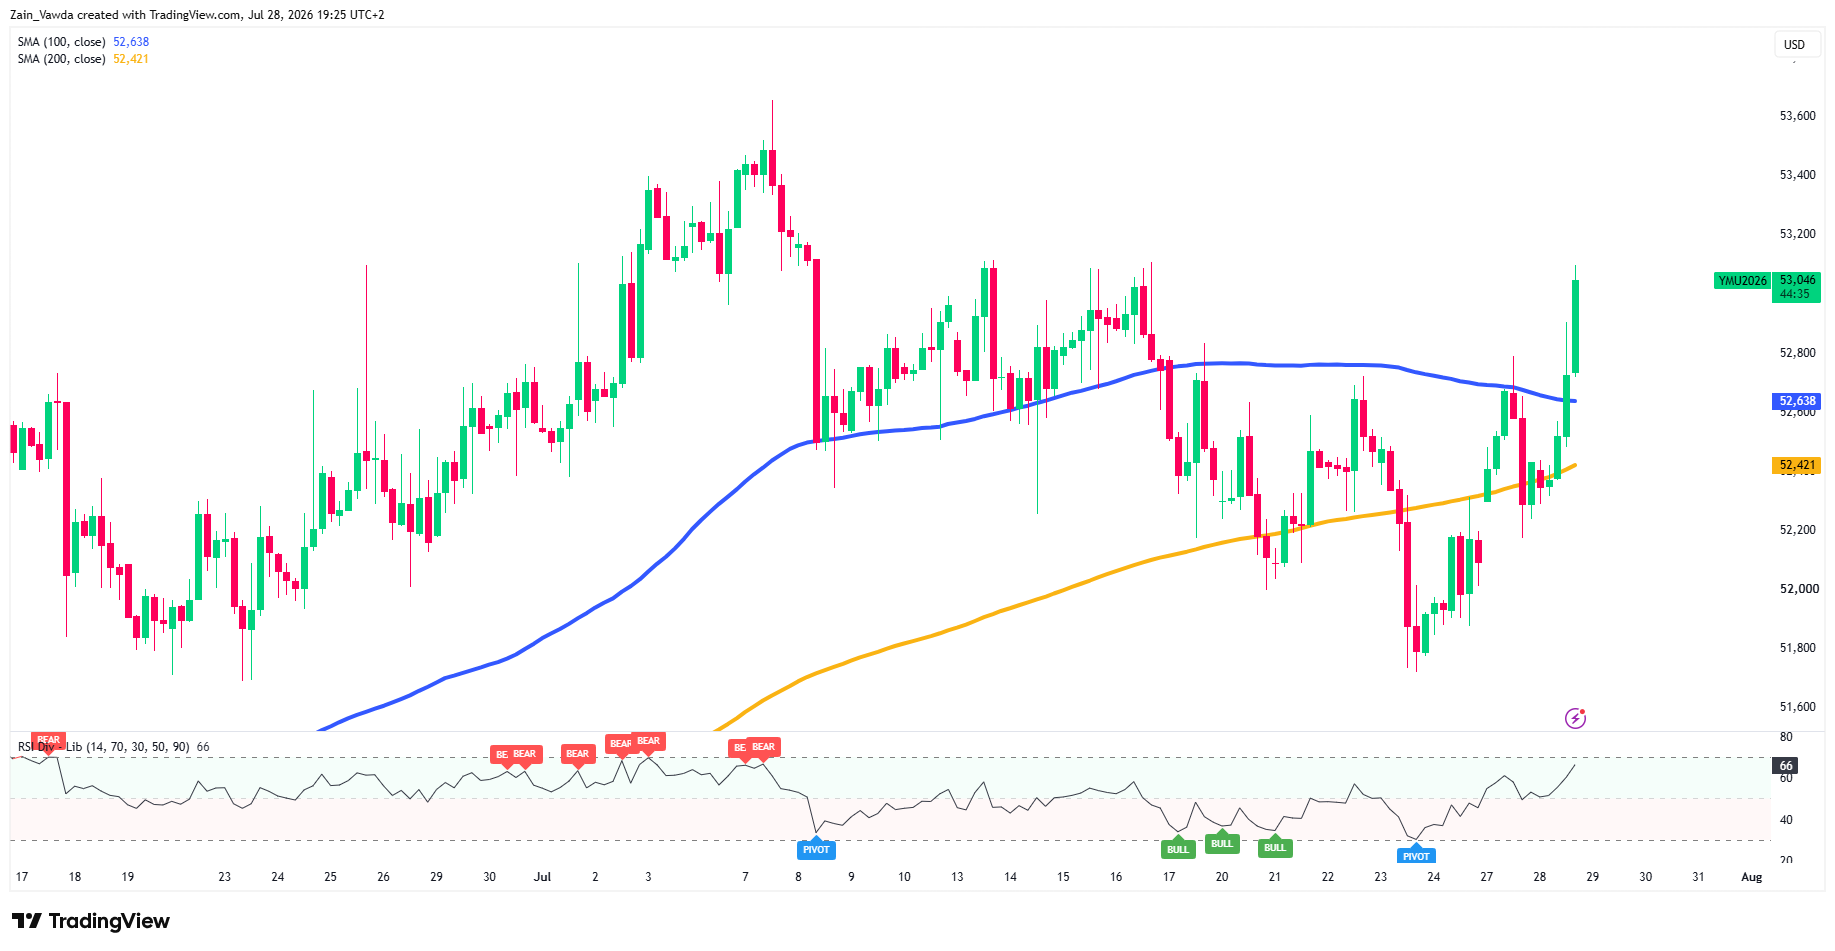
On the four-hour, YM has punched back above its 100-period MA (52,638) with a decisive green candle, reclaiming the level that capped every rally through mid-to-late July. The 100 sits above the 200 MA (52,421) — a bullish alignment — and both now curl up beneath price.
What mattered structurally was the sequence of higher lows off the July 23–24 base near 51,700; today’s break clears the down-sloping structure that defined the month.
The H4 RSI at 66 is rising out of its late-July bullish pivot and has not yet reached overbought, so on this timeframe there is still room toward the early-July highs at 53,400 and the 53,600 record zone.
Dow Jones Four-Hour Chart, July 28, 2026
Source: TradingView
H1 — overbought, with a bearish divergence into the Fed
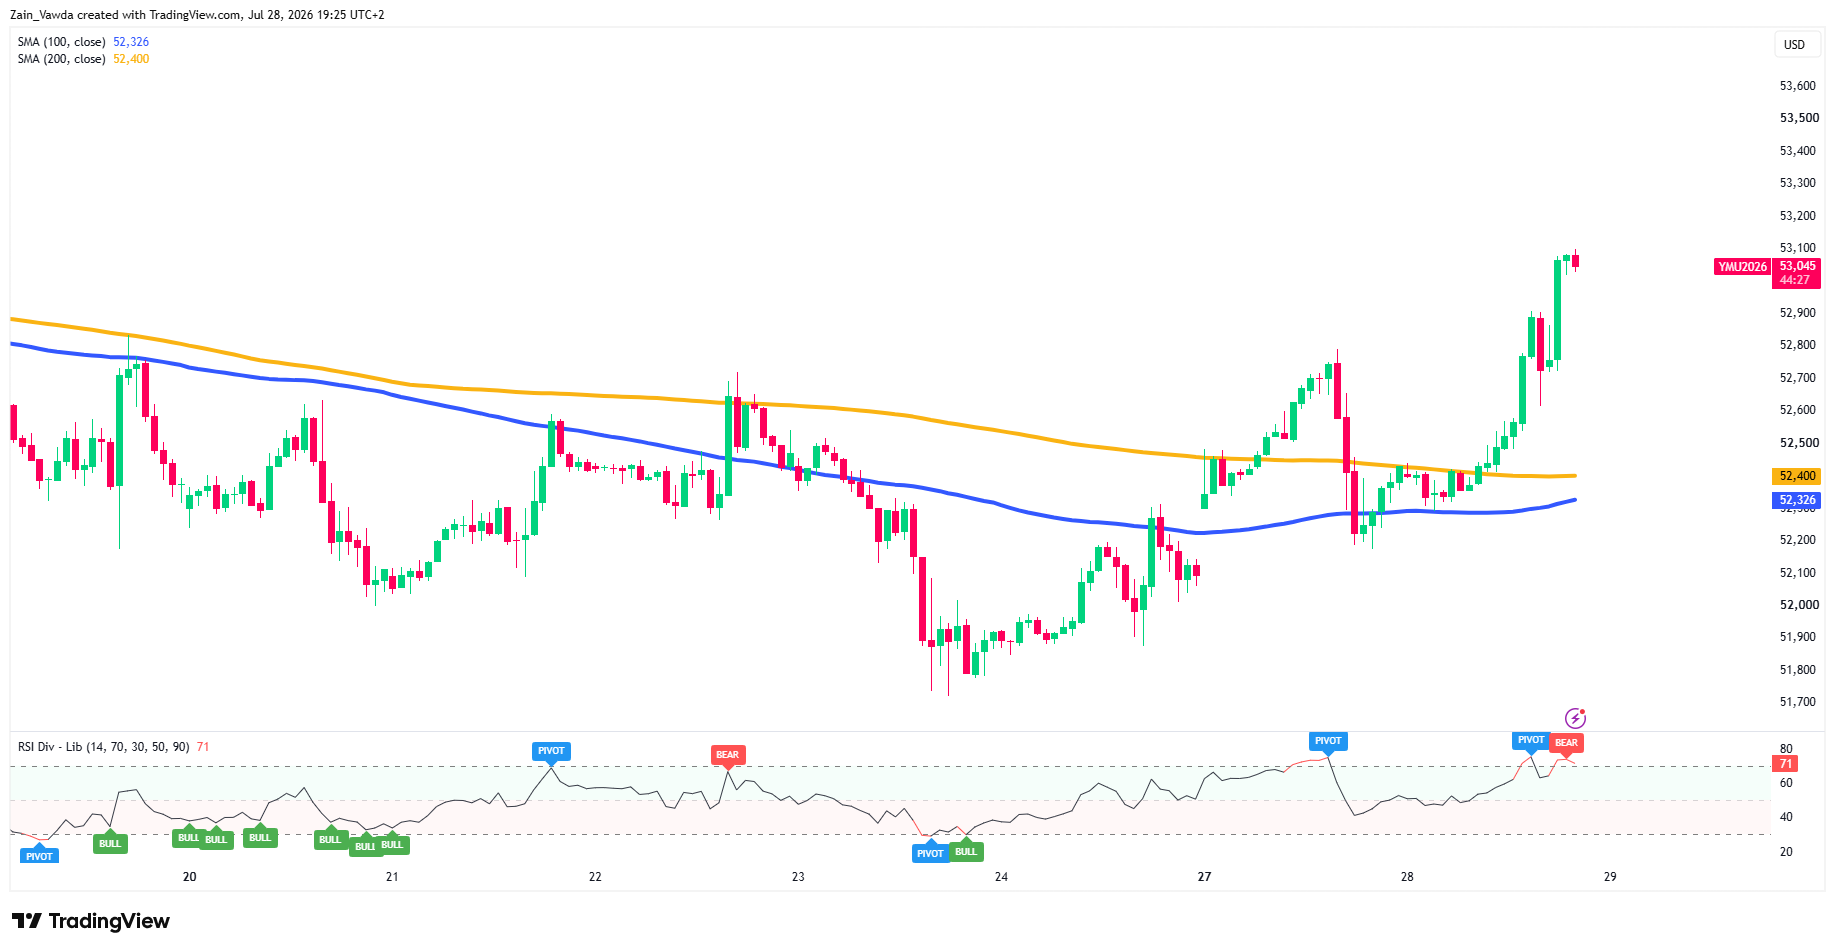
The hourly tells a more cautious near-term story. Price has surged well above its H1 moving-average cluster (100 MA 52,326, 200 MA 52,400) to a session high near 53,090, but the RSI is stretched to 71 and printing a bearish divergence at the highs — a higher price high against weaker momentum.
That is a classic exhaustion signal, and it arrives with price extended some 650 points above its own averages and directly into a binary Fed event.
It does not negate the H4 uptrend; it argues the next move is more likely a pullback or consolidation to relieve the stretch than an immediate vertical extension.
Now of course we do know as traders, the RSI can go higher and remain in overbought territory for prolonged period. With an FOMC ahead and one that is expected to have a significant impact on volatility is important to remember.
Dow Jones One-Hour Chart, July 28, 2026
Source: TradingView
Levels and the confluence that matters
The pullback map is clean.
First support is the reclaimed H4 100-MA at 52,638. The decisive zone is 52,400–52,420, where the H1 200-MA (52,400) and the H4 200-MA (52,421) overlap almost perfectly, a hold there keeps the bullish structure fully intact, a sustained loss flips the near-term bias.
Resistance is the 53,090–53,100 session high, then 53,400 and the 53,600 record zone.
The question into the FOMC for traders is whether the Dow is on course for fresh all-time highs or is a deep pullback on the horizon?


