Top-down, Dow Jones (YM) is coiled at a multi-timeframe decision point beneath a 52,620–52,760 resistance shelf, mapped mid-afternoon ET with Alphabet and Tesla due after the close. The moving averages disagree across timeframes — and that disagreement is the setup.
The Broad Structure
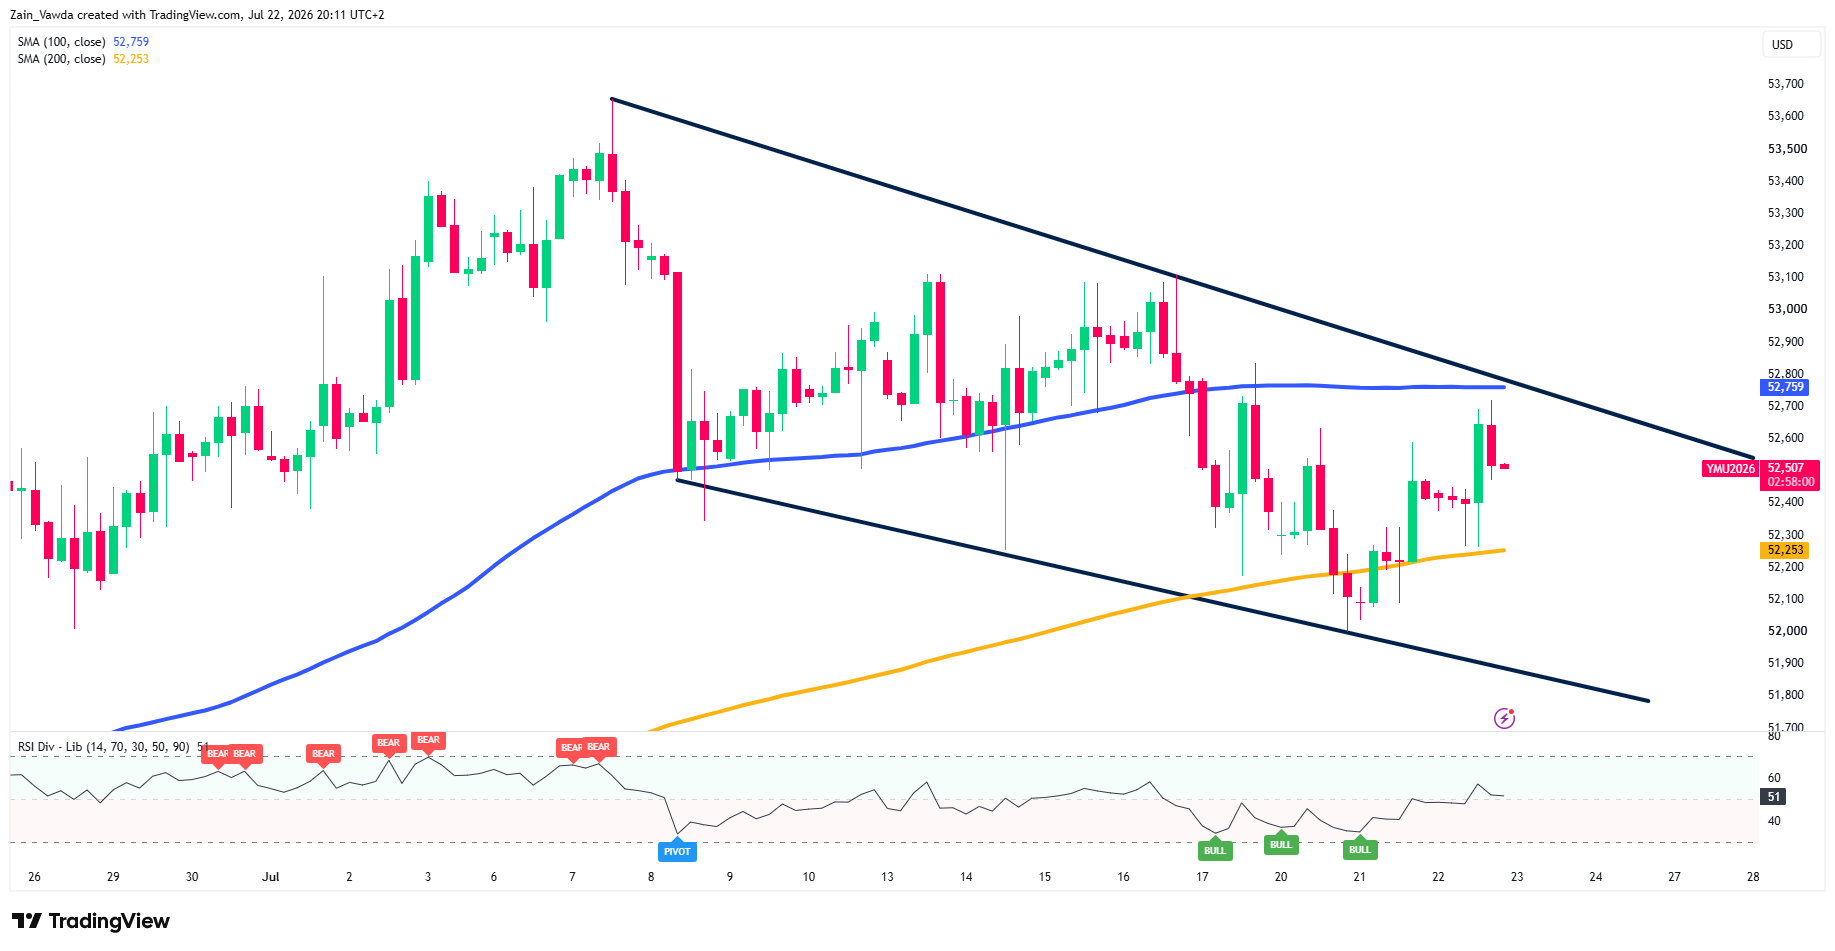
Since the July 7–8 peak near 53,650, YM has carved a descending structure and now sits mid-range at 52,507, caught between a flattening 100-MA (52,759) overhead and a rising 200-SMA (52,253) beneath.
The 100-over-200 stack keeps the broader picture constructive, but price trading below the 100-MA amid a run of lower highs keeps the H4 tilt corrective. The bounce off the rising 200-MA and channel base (~52,050–52,250) is the bulls’ anchor;
RSI is neutral at 51, offering no divergence edge either way.
Dow Jones Four-Hour Chart, July 22, 2026
Source: TradingView
Bias — NEUTRAL: rangebound, only constructive on an H4 close back above 52,759.
The Intraday Channel
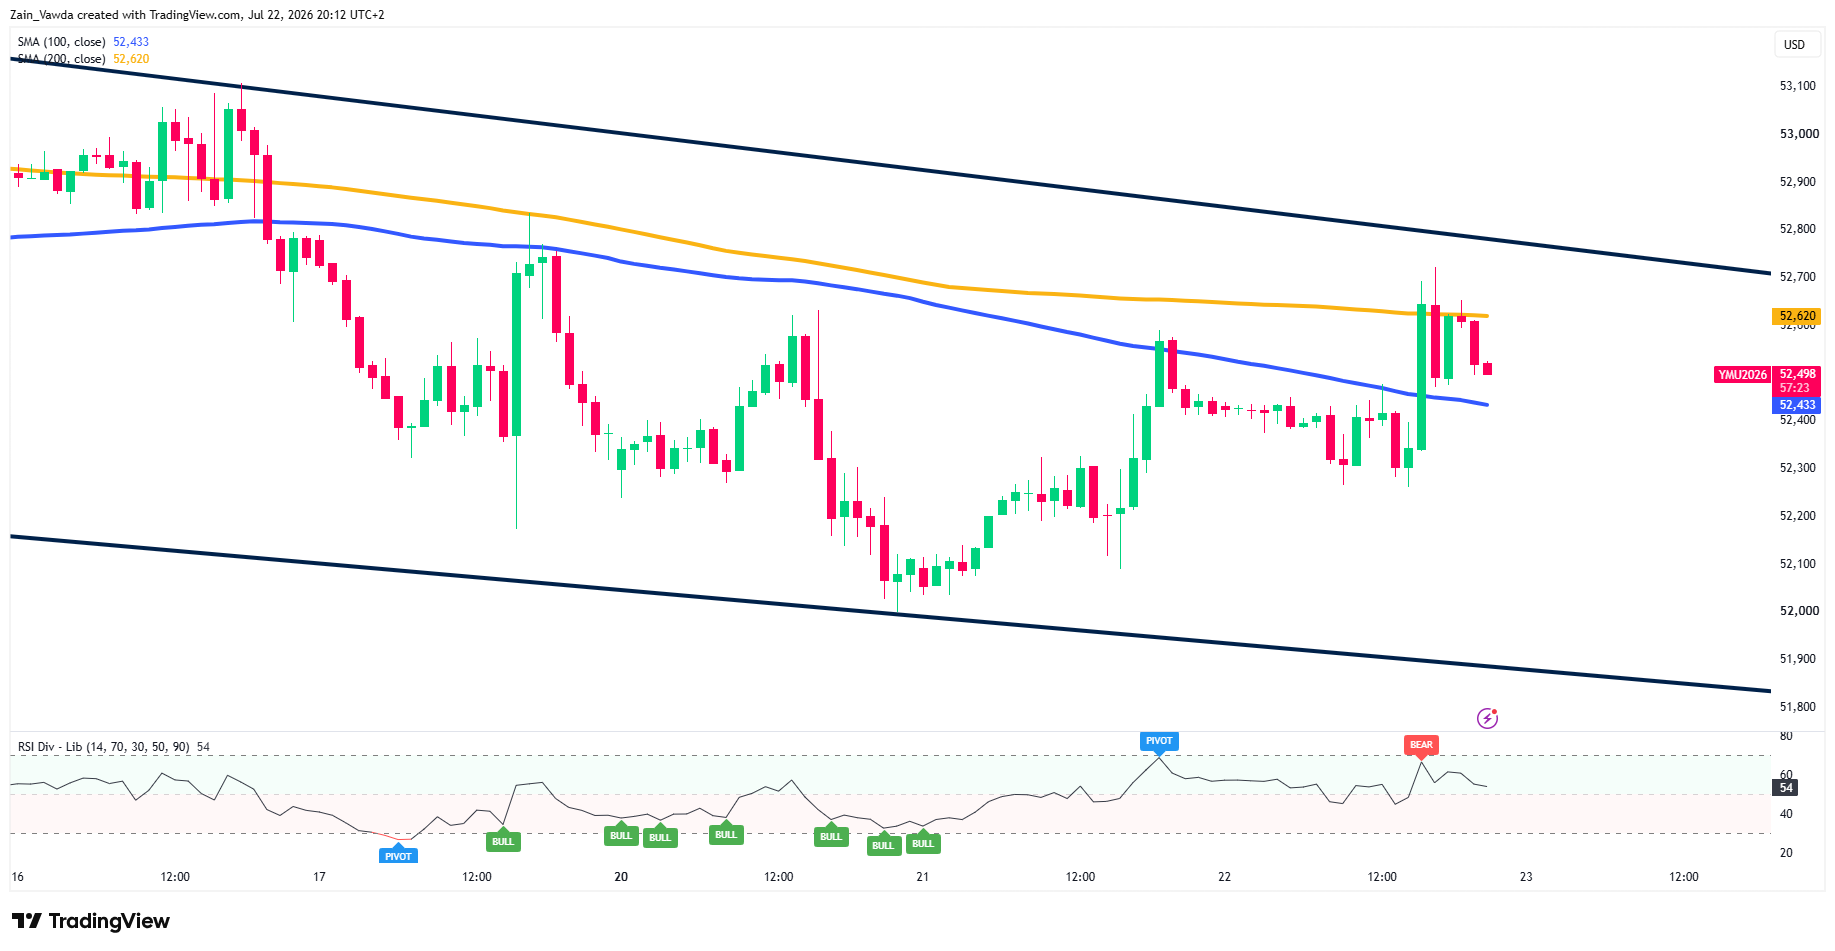
The hourly channel is cleaner and slightly heavier. Here the 100-MA (52,433) sits below the 200-MA (52,620), a bearish near-term stack and today’s rally drove straight into that 200-MA before rejecting, printing a BEAR RSI divergence at ~52,650.
Dow Jones One-Hour Chart, July 22, 2026
Source: TradingView
Price is now pinned at 52,498 between the two averages. This is the pivotal band: 52,620 caps the tape, and a failure to reclaim it keeps the descending channel intact, risking rotation back toward 52,300 and then the channel base near 52,050.
RSI 54, rolling off the divergence high.
Bias — NEUTRAL-BEARISH: capped below 52,620; the reclaim is the bull trigger.
The Near-Term Tape
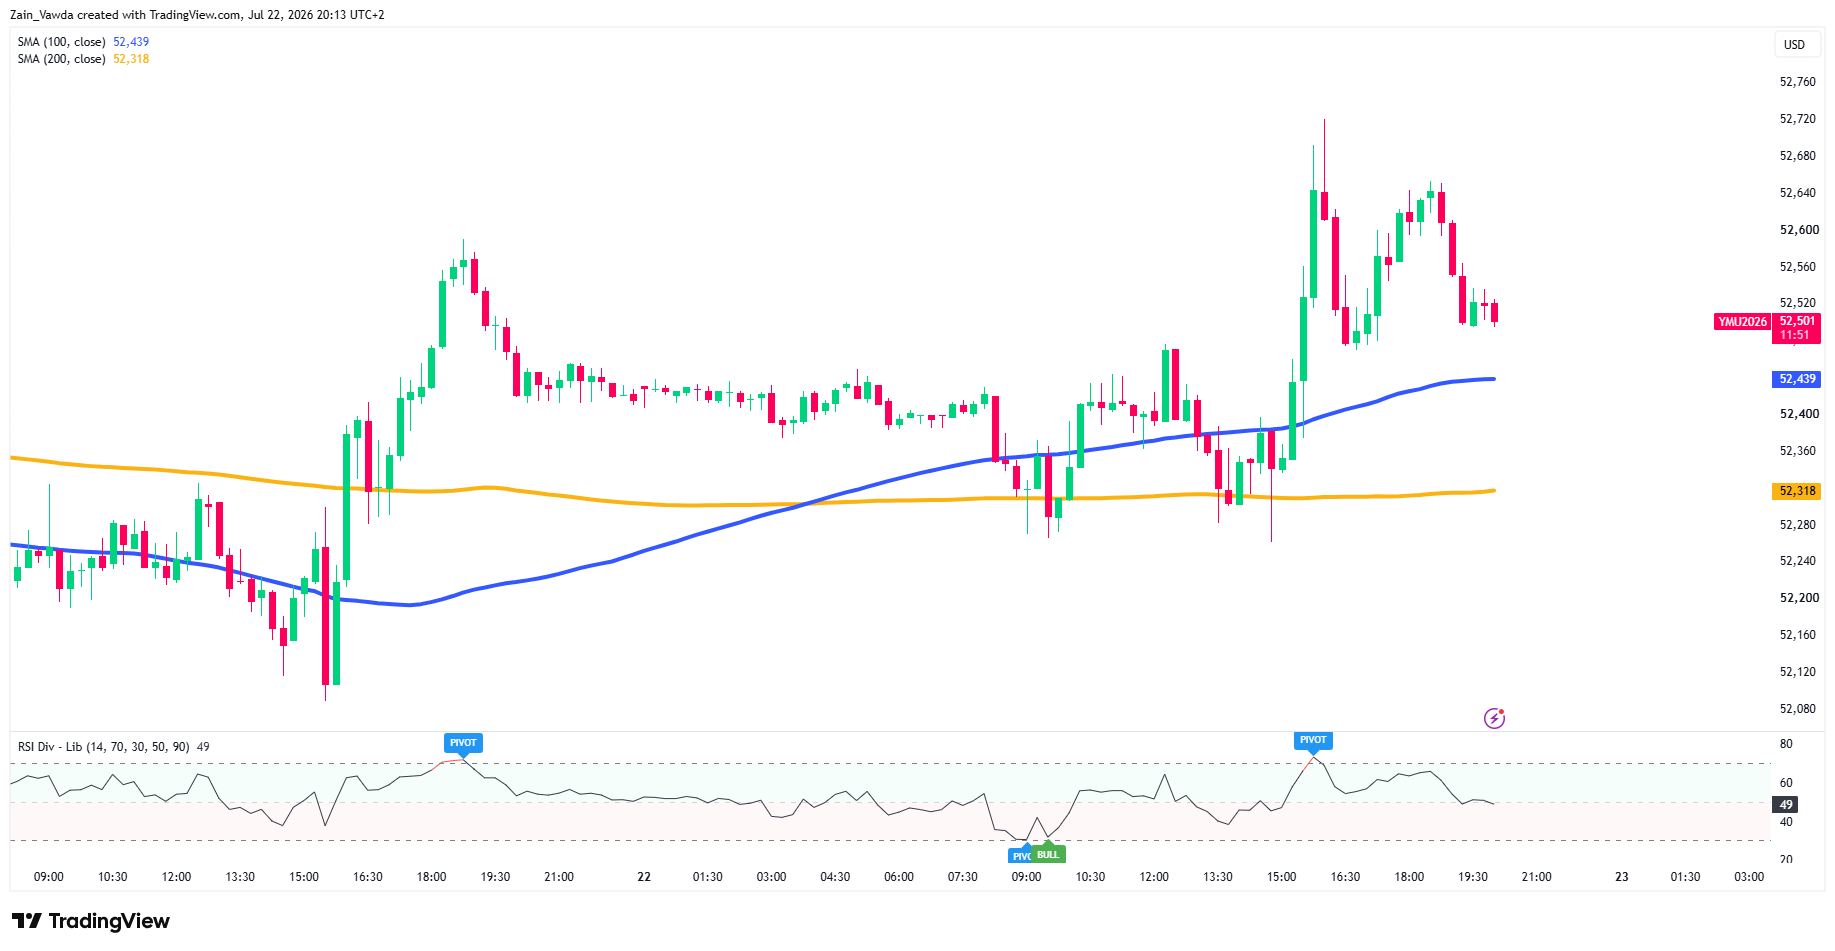
The shortest timeframe is the firmest: price (52,501) holds above a rising 100-MA (52,439) and 200-MA (52,318), a clean bullish stack. But momentum is fading — the advance stalled at a lower high (~52,640) beneath the session spike (~52,720), and RSI has slipped back to 49.
Dow Jones M15 Chart, July 22, 2026
Source: TradingView
The 52,439 100-MA is the line in the sand: hold it and the up-leg can retest 52,640 then 52,720; lose it and 52,318, then the 52,300 shelf, open quickly.
Bias — UP, DECELERATING: 52,439 is the trigger that keeps the intraday bid alive.
Net Read
Three timeframes converge on one zone. 52,620 is the immediate pivot; above it, 52,700 and 52,759 form the resistance shelf that caps a squeeze.
Below, 52,433–52,439 is first support, then 52,318, the rising 52,253 trend support, and the 52,050 base. With price coiled into tonight’s Alphabet and Tesla reports, this is two-sided gap risk, not a trend


