
On the surface, Wednesday looks like a nothing day. S&P 500 futures (ES) are pinned near 7,68 and Dow futures (YM) are hovering around 53,500 both barely moved, both coiled inside their moving averages. But look one level down and the tape is anything but calm.
Individual stocks are moving 5%, 8%, even 37% in a single session, and in both directions. That gap, a quiet index sitting on top of violent single-stock moves is the real story for futures traders today.
It rarely stays quiet; it usually resolves at the next big catalyst.
A Tape Pulling Itself Apart
Retail is the clearest split. Nike slid to a 12-year low after Truist cut it to Hold, warning that weak full-year guidance from Dick's Sporting Goods where Nike makes up an estimated 35–40% of the merchandise, points to more pain ahead. The stock is now down close to 40% in 2026.
Yet on the very same day, Abercrombie & Fitch soared roughly 37% after beating estimates and raising its outlook, helped by tariff refunds, while Kohl's rose about 2% and even restarted share buybacks. Same sector, same consumer, opposite outcomes.
Software is the second fault line. Intuit fell about 4% on soft fiscal-2027 guidance, and the read-through dragged ServiceNow and Workday down roughly 2% and Salesforce around 1%. SAP dropped about 3% on a UBS downgrade tied to slow delivery of “agentic” AI, software that can act on its own rather than wait for prompts. Zoom lost around 7% on a light forecast.
Note what this is not: a software-demand wobble, not the AI-chip story that has dominated the headlines all month.
Then the one-offs. Boston Scientific fell about 5% after disclosing a cyberattack expected to disrupt access to its products, with no restoration timeline given. Meta gained around 3% on settling a state case over teen app safety.
Solar and chip names SolarEdge and Semtech both jumped roughly 8% on an upgrade and an earnings beat, respectively.
Why the Dow (YM) is Holding Up Better than the S&P (ES)
Here the index mechanics matter, and they explain the split. The Dow is price-weighted, meaning a stock's pull on the index depends on its share price, not its size.
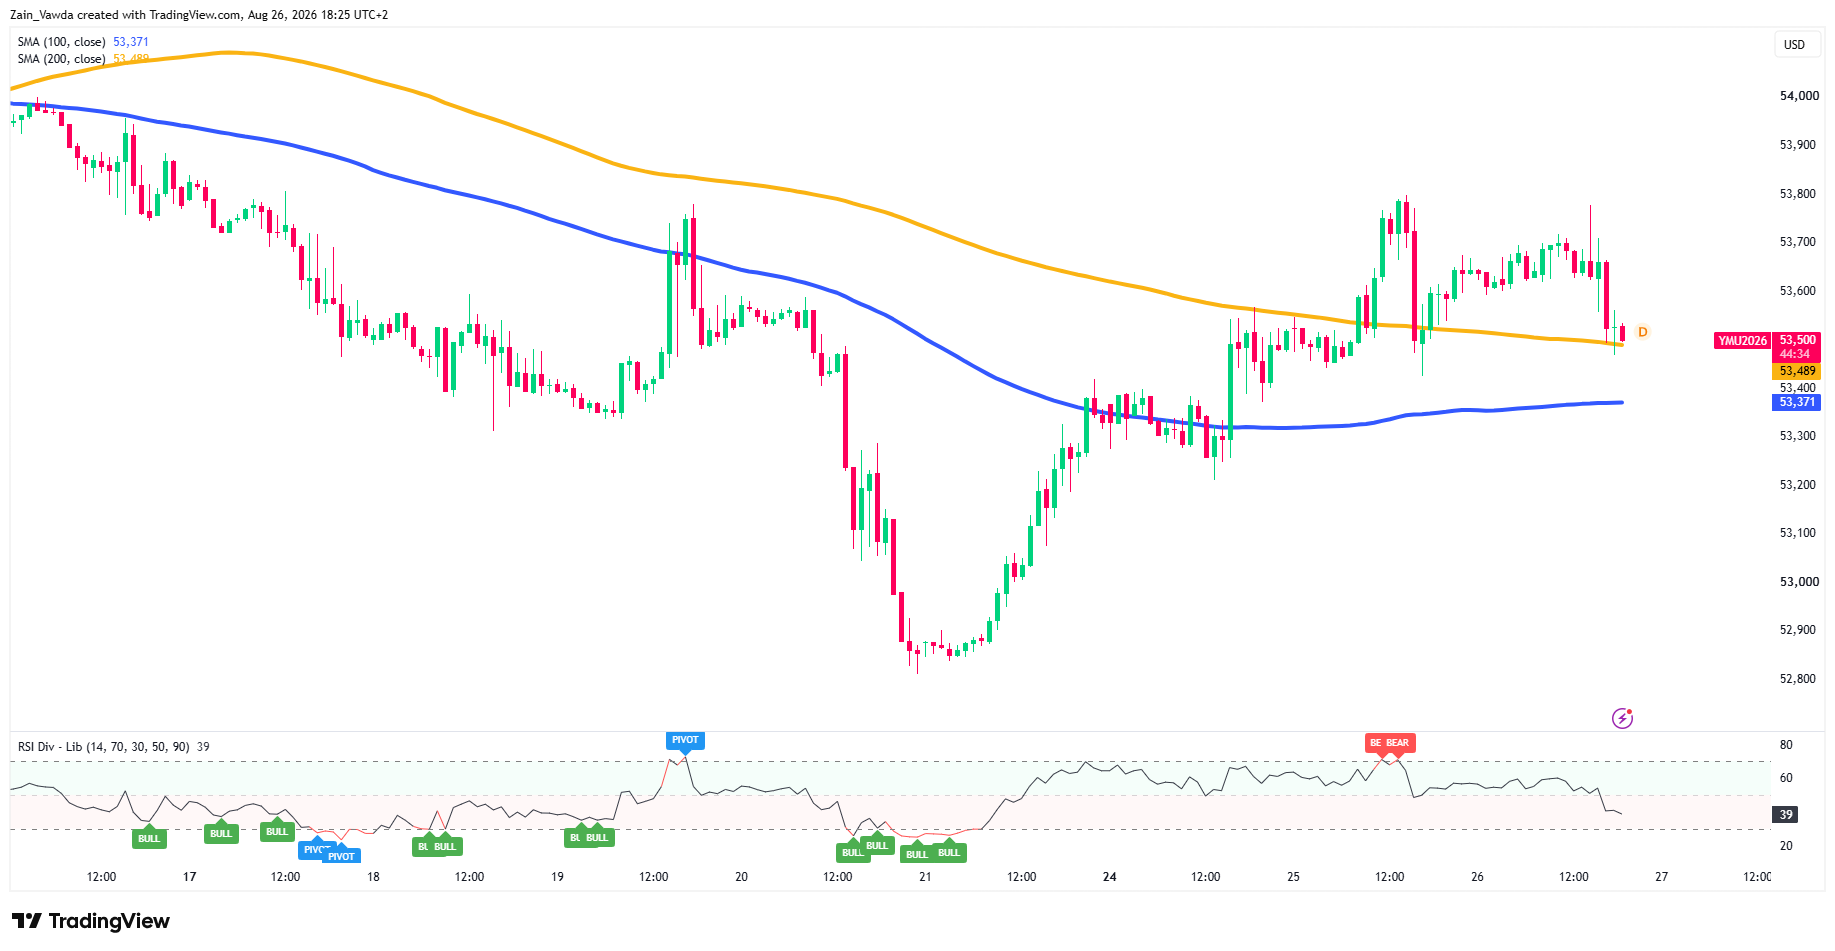
Nike trades near $40 the lowest-priced name in the Dow, so despite the scary “12-year low” headline, it carries only about half a percent of the index. Salesforce, also caught in the software drag, is likewise a modest weight. That helps explain why YM has recovered almost all of its August 52,800-to-53,800 range and is holding above its 100-period moving average near 53,371, even as the bad headlines pile up.
Dow Jones (YM) One-Hour Chart, August 26, 2026
Source: TradingView
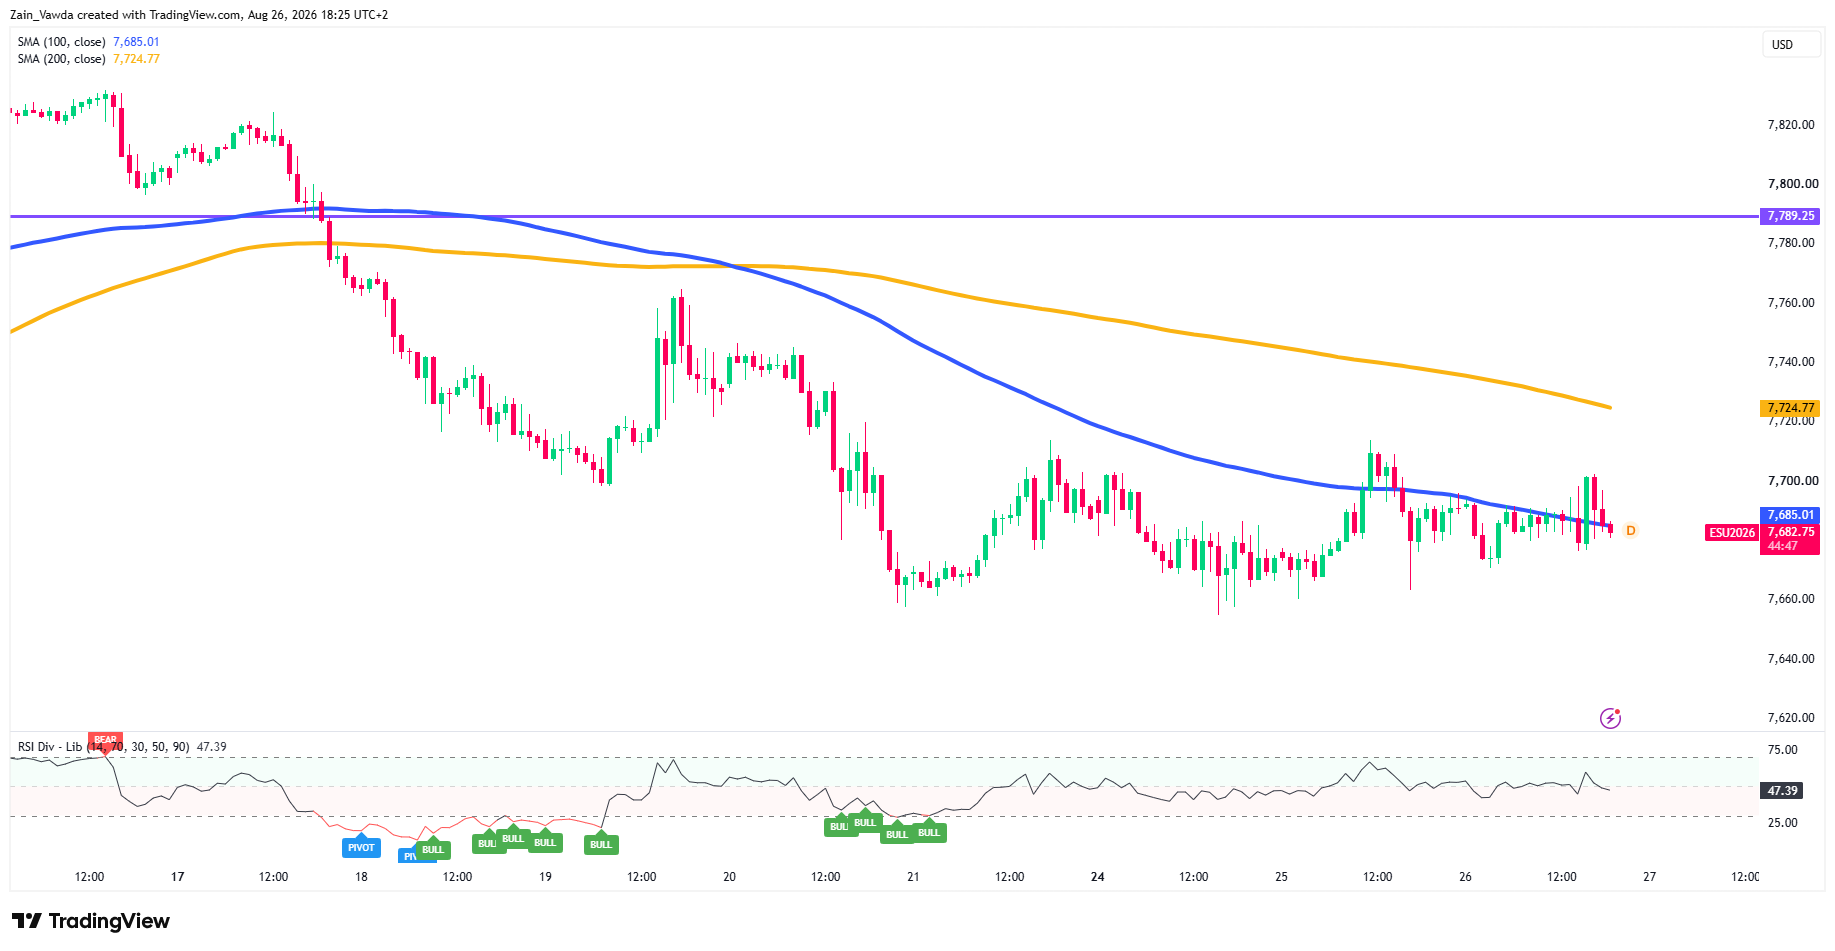
ES is heavier. It sits right on its 100-period average near 7,685 but below the falling 200-period line near 7,725, and well under the 7,789 shelf that has capped every rally this month.
S&P 500 (ES) One-Hour Chart, August 26, 2026
Source: TradingView
In its larger, more tech-heavy basket the winners and losers are roughly cancelling out — hence the chop. Both contracts flashed a bearish RSI divergence at last week's highs (momentum failing to confirm the higher price), which is exactly the kind of warning that precedes a fade back into the moving-average cluster.
The Levels that Matter
YM: the pivot cluster sits at 53,371–53,489. Holding above it keeps 53,780 in play; a clean break below opens 53,000 and then the 52,800 base.
ES: 7,685 (the 100-period line) is the line in the sand. Reclaim 7,725 and the 7,789 shelf comes back into view; lose 7,660 and the range breaks lower. All levels amber-flagged — confirm on your own contract and month before acting.
Scenario Matrix: Keyed to Jackson Hole (Warsh, Fri Aug 28)
| Bull | Warsh reads dovish-enough Friday: yields ease and the coil breaks up. ES reclaims 7,725 then eyes the 7,789 shelf; YM retests 53,780+. The winners (recovering consumer, solar/chip beats) lead. |
| Base | No clean signal from Jackson Hole: ES and YM keep grinding inside the moving-average cluster (ES 7,660–7,725; YM 53,371–53,780). The index stays flat while single-stock dispersion stays high, a stock-picker's tape. |
| Bear | Warsh leans hawkish and the September hike bet is back on: yields climb, ES loses 7,660 and YM breaks 53,000 toward the 52,800 base. Software and consumer losers set the tone. |
For the Trader
In a dispersion tape like this, the edge is discipline, not prediction. The temptation is to chase whichever stock is printing the biggest number; the more repeatable approach is to trade the index level and let the single-name noise cancel out, which is precisely what a flat ES and YM are already doing for you.
The profitable-versus-unprofitable cohort split on ES and YM needs a live Positioning Edge pull before it anchors a bias; treat the read above as the behavioural takeaway, not a positioning call.
For the latest data on trader positioning, make use of the Marketframework Positioning Edge Tool and stay ahead of the curve.


