
The Setup: A Monster August, Then a Stall
Bitcoin just had its best month of 2026. Through August it climbed roughly 24%, breaking out of a long, quiet range near $63,000–$65,000 and pushing all the way above $80,000.
That is a huge move in a short window. But the party paused right at the round number: every attempt to hold above $80,000 was sold, and price has since drifted back to around $77,400.
So the real question is no longer “did Bitcoin break out?”, it clearly did. It is whether the breakout can survive September, historically Bitcoin’s weakest month (an average drop of about 3%), and especially so after two strong months in a row.
What Changed: Warsh Put a Rate Hike Back on the Table
The trigger for the stall was the Federal Reserve. At the Jackson Hole conference on August 28, Fed Chair Kevin Warsh gave a hawkish speech, meaning he leaned toward keeping policy tight to fight inflation. He noted that inflation (measured by PCE) is still running near 3.7% a year, well above the Fed’s 2% goal.
Markets reacted fast. The odds of a September rate hike jumped from around 35% to roughly 57–58%, now at around 66%.
In plain terms: traders now see a coin-toss chance the Fed raises rates on September 15–16, which would lift borrowing costs from 3.50–3.75% to 3.75–4.00%. Higher rates make risky assets like Bitcoin less attractive, so BTC dipped about 3% below $77,000 before steadying.
Spot Bitcoin ETFs also snapped a nine-day run of inflows with an outflow on August 28, a sign some big buyers stepped back ahead of the decision.

Source: Farside Investors
Not everyone agrees a hike is coming. JPMorgan still expects the next move in December, and prediction markets lean slightly toward a hold. It is genuinely two-sided.
The Chart: A Wall Above, A Cushion Below
The two timeframes tell one story.
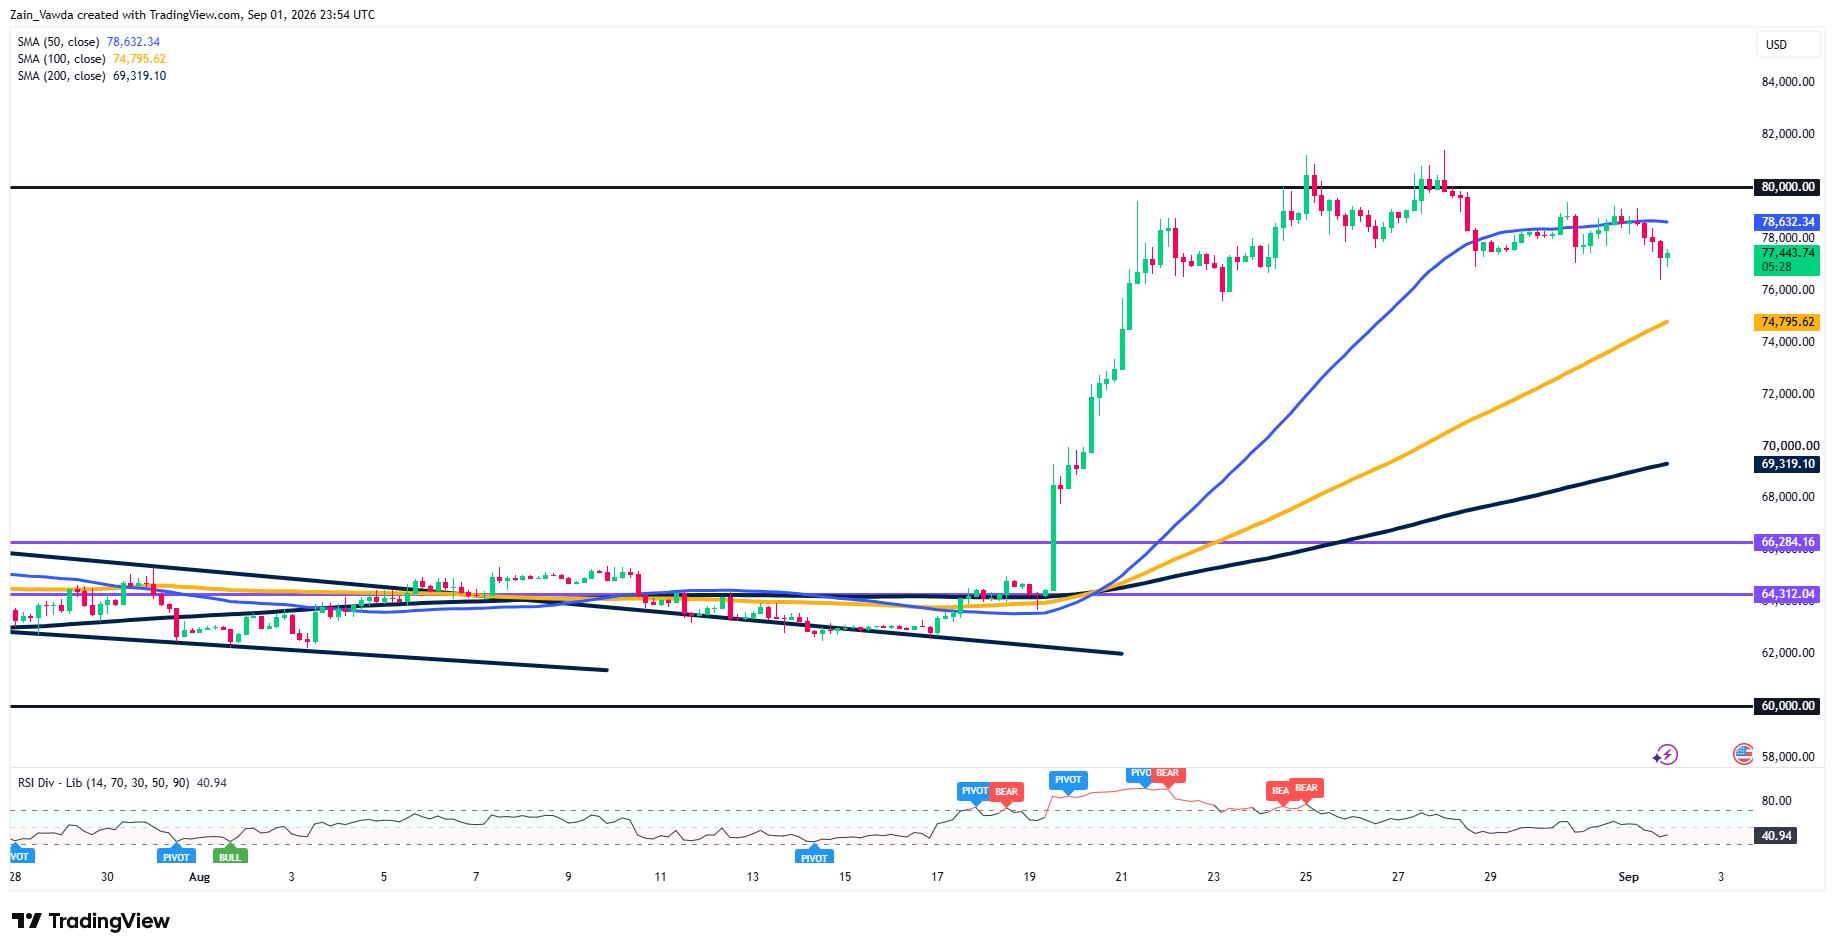
On the higher timeframe the trend is still healthy: price sits well above the rising 100-day and 200-day moving averages (around $74,800 and $69,300), and the August breakout is intact. A moving average is simply the average price over a set number of bars — when they rise and price stays above them, the bigger trend is up.
Bitcoin Four-Hour Chart, September 1, 2026
Source: TradingView
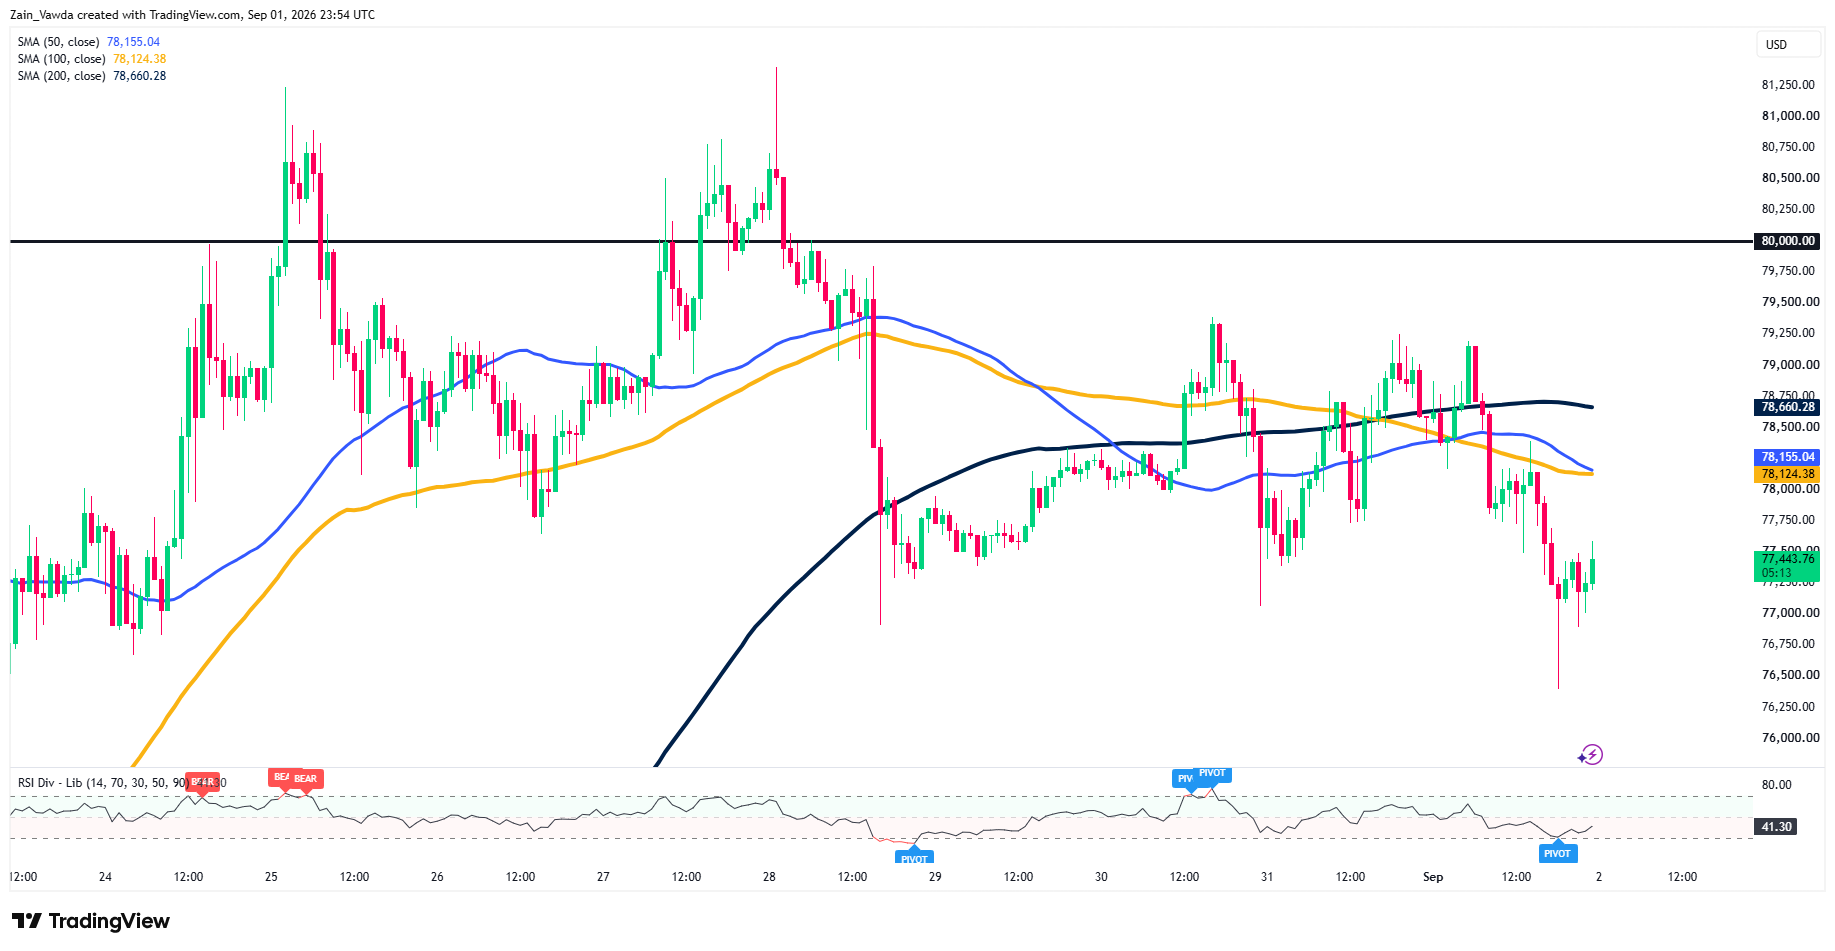
Zoom in, though, and it looks heavy. On the lower timeframe the 50-, 100- and 200-bar averages are bunched tightly around $78,100–$78,700, sitting just above price. That cluster now acts as a “wall” capping the bounce. Momentum (RSI) is weak but not yet washed out.
Bitcoin One-Hour Chart, September 1, 2026
Source: TradingView
One thing supporting the bulls: large holders (“whales”) are still buying. They added roughly 39,154 BTC, about $3 billion in a single week, and Strategy ended a 10-week pause with a $370 million purchase. Steady accumulation into a dip usually signals conviction, not panic.
Bull / Base / Bear into the September 15–16 FOMC
| Case | Trigger | Likely Implication |
|---|---|---|
| Bull | Fed holds (or soft data cuts hike odds) and ETF inflows resume | Reclaim $78,700, then break $80,000 and retest ~$82,200; momentum opens room higher |
| Base | Genuine coin-toss meeting; the market waits | Chop between $76,800 and $80,000 into the decision, the wall caps, the cushion holds |
| Bear | Fed hikes or stays hawkish, ETF outflows extend, September seasonality bites | Lose $76,800 → $74,800, then risk toward the low-$70,000s and the $69,800–$70,300 band |
For Traders
The classic losing move into an event like this is chasing, buying the breakout late near $80,000 and marrying a directional bet right before a 50/50 Fed decision.
In a coin-toss macro event, sizing is the edge, not the guess.


