
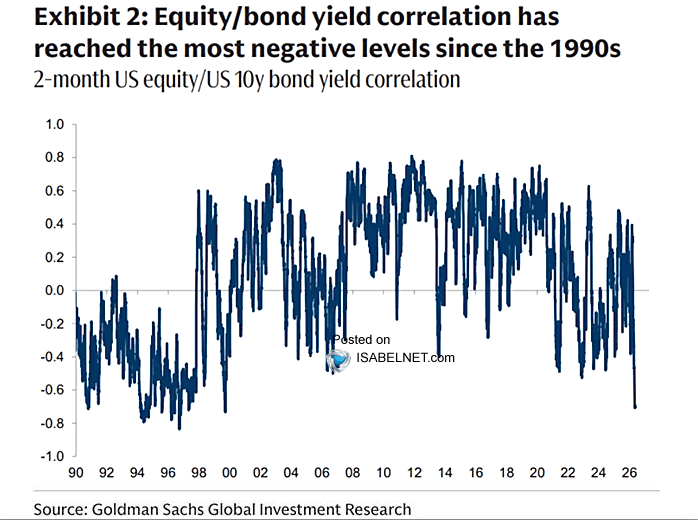
The two-month correlation between US equity prices and bond yields has turned deeply negative (reaching levels not seen since the 1990s).
Source: Goldman Sachs Global Investment Research, Isabelnet
To understand what this means for US stocks, it helps to first decode the mechanics, explore why this is happening right now, and look at the historical playbook.
Decoding the Mechanics (Prices vs. Yields)
It is crucial to distinguish between bond prices and bond yields (which move in opposite directions).
- A negative correlation between Stock Prices and Bond Yields means that when bond yields go up, stock prices go down.
- Conversely, because bond yields and bond prices are inverted, this means Stock Prices and Bond Prices move together (positively correlated).
This is a stark departure from the "normal" regime of the last two decades (2000–2022), where stocks and yields usually moved together because strong economic growth lifted both corporate earnings and interest rates.
Why is This Happening Now?
A deeply negative stock-to-yield correlation means the market is entirely focused on inflation, interest rates, and Federal Reserve policy, rather than corporate earnings or economic growth.
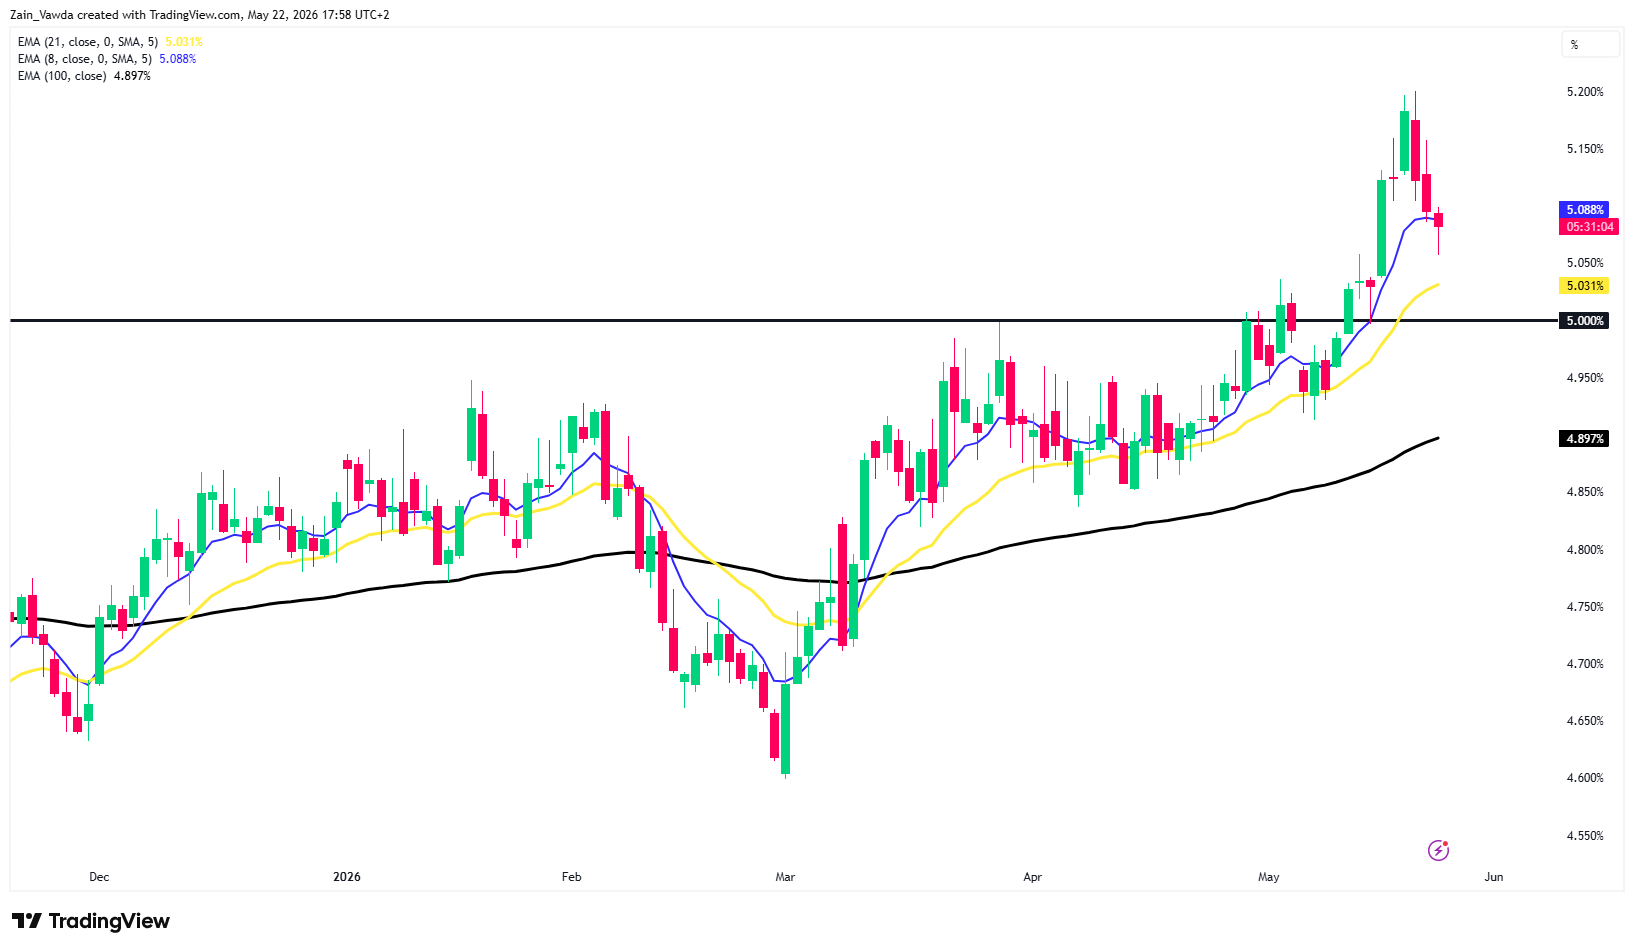
When inflation exhibits sticky-ness or heavy Treasury supply causes a "capitulation-style" sell-off in bonds, yields surge (with the 30-year Treasury recently piercing 5%). Because the correlation is heavily negative, equity markets immediately buckle under the weight of those rising yields.
Source: TradingView
Surging yields hurt stocks in three direct ways:
- The Valuation Squeeze: Higher yields mean a higher discount rate applied to future corporate cash flows. This heavily penalizes high-growth stocks (like Mega-cap Tech/AI), compressing their price-to-earnings (P/E) multiples.
- Competition for Capital: When risk-free Treasury yields cross psychological thresholds (like 5%), bonds become a highly attractive alternative to stocks. Investors no longer feel forced to take equity risks to get a decent return.
- Higher Borrowing Costs: Higher yields trickle down into the real economy, raising the cost of capital for corporations and squeezing smaller, debt-reliant companies (like those in the Russell 2000).
Now this has not happened yet despite the surge in yields off late. Over the last week markets continued their advance with the S&P 500 on course for a 9th consecutive week of gains.
This begs the question, will history repeat itself or will this time be different.
The 1990s Parallel: Will History Repeat Itself
The last time markets experienced similar conditions was during the late 1980s and 1990s. Looking back at that playbook gives us an idea of what could possibly be on the horizon.
When the market shifts this way, it usually signals trouble ahead; sudden jumps in bond yields tend to trigger quick stock market drops, making stocks hyper-sensitive to everyday economic news like inflation and jobs reports.
Second, the traditional 60/40 investment strategy historically breaks down. For two decades, investors relied on bonds to gain value when stocks fell, acting as a safety net. In this 1990s-style environment, however, stocks and bonds move together, meaning a bad economic report can cause both to crash at the same time and leave investors with nowhere to hide.
Finally, the market will split into clear winners and losers. Massive, cash-rich growth companies like the Dot-Com giants of the '90s or the AI leaders of today can ignore rising interest rates because their profits are so strong.
Meanwhile, smaller companies, regional banks, and heavily indebted businesses will get crushed quickly as borrowing costs rise.
For US stocks, a 1990s-style negative stock/yield correlation means the equity market may have lost its safety net. Equities are currently highly vulnerable to the bond market. Until inflation stabilizes and bond yields find a definitive ceiling, any sudden upward move in interest rates will act as a direct, immediate headwind for stock prices.
The question is, will such a scenario play out or will stocks continue to defy the signs and edge higher?
S&P 500 Futures: Strong Momentum as Minor Resistance Lies Ahead
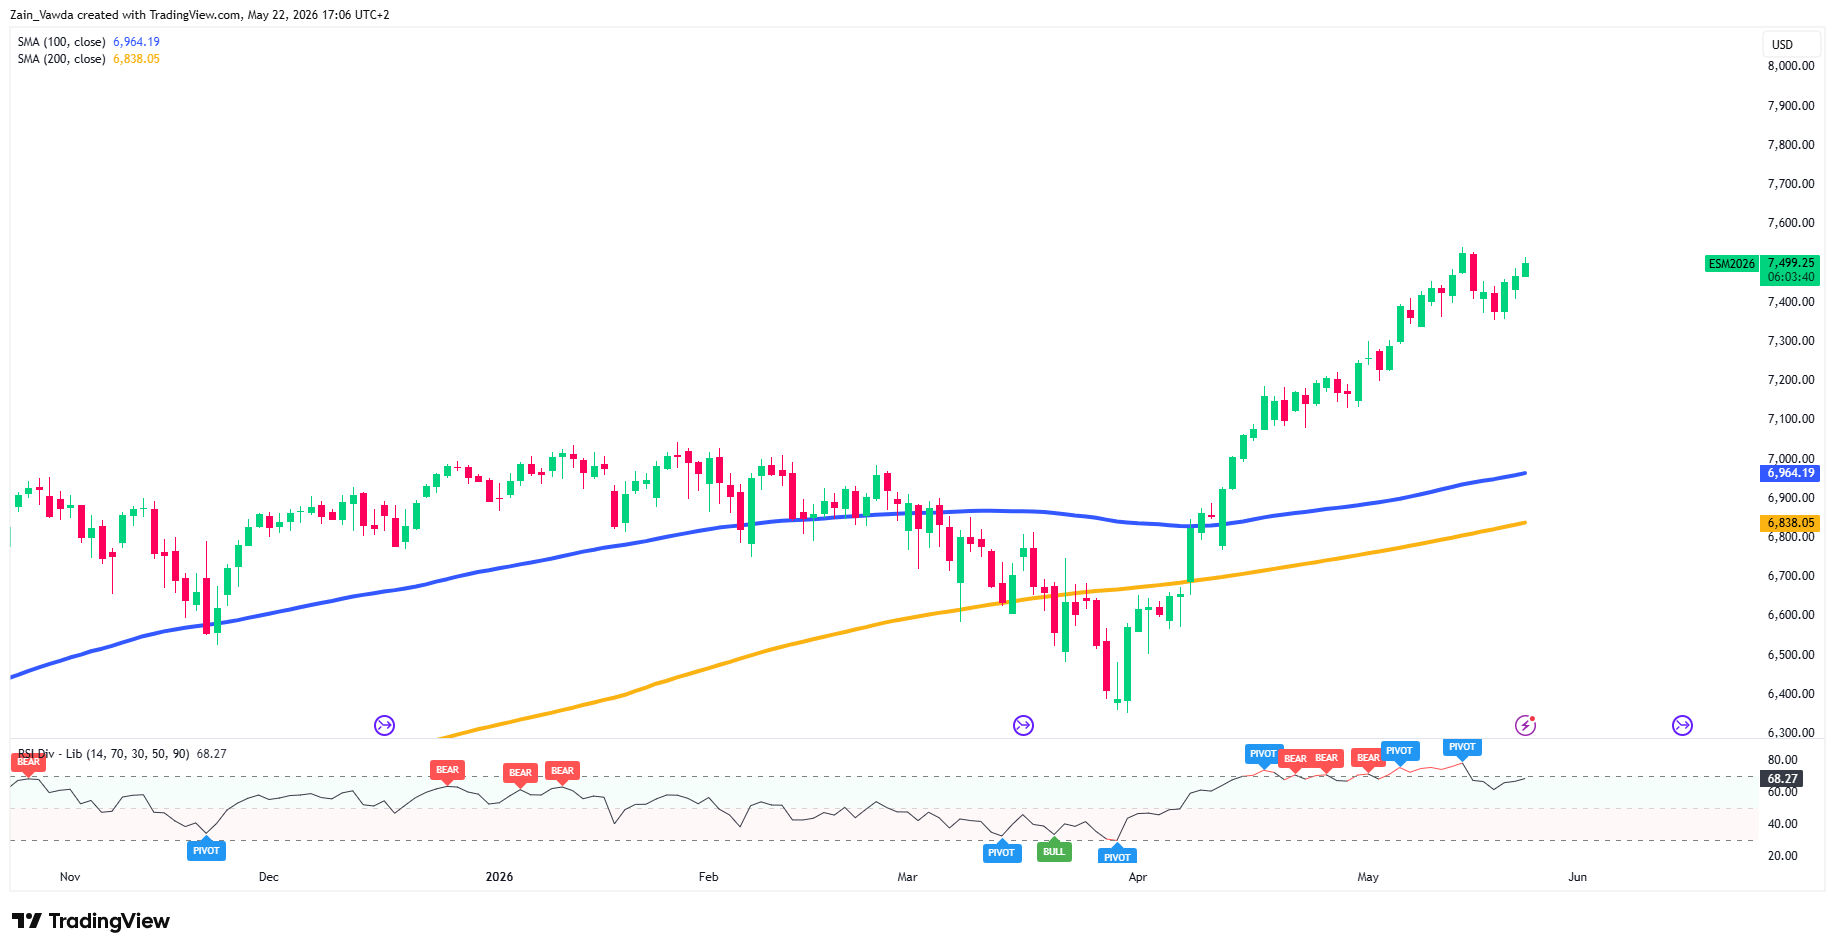
From a technical perspective, the S&P 500 futures daily chart shows a strong bullish trend resuming following a brief pullback at the start of the week.
Price action is firmly supported by its upward-sloping 100-day Moving Average (MA) at 6,964.19 and 200-day MA at 6,838.05, confirming a robust, long-term uptrend.
The index is currently trading near its highs at 7,513.25. This indicates intense buying pressure and minimal overhead resistance. There is very little in the way of historical price action to analyze at these levels which complicate matters as well.
S&P 500 (ES1!) Futures Chart, May 22, 2026
Source: TradingView
However, momentum warrants caution. The RSI (14) is sitting at 68.27, rapidly approaching the overbought territory (70.00) which hints that the market may soon face a temporary breather or short-term consolidation before pushing higher.
Support: 7,400 (recent swing low), 7,200, 6,964 (100-day SMA)
Resistance: 7,550–7,600 (psychological/all-time highs), 7,750
Read Next: US-Iran Deal vs Oil Supply Reality: Why Crude Prices Won't Crash Despite Hormuz Reopening