
Gold's powerful 2026 rally is increasingly becoming a crowded trade, but the latest Commitments of Traders (COT) data suggests speculative positioning has not yet reached the kind of extreme levels typically associated with a major top.
The latest CFTC disaggregated report for the week ended Aug. 18 shows Managed Money traders holding 154,595 long contracts against just 12,947 shorts, leaving the group net long 141,648 contracts. Hedge funds added 5,961 fresh longs during the week while also increasing shorts by 1,975 contracts, indicating that bullish conviction remains dominant despite some profit-taking and hedging activity.
Total open interest stood at 406,260 contracts as of Aug. 18, underscoring the substantial participation behind the gold futures market.
Funds Remain Aggressively Bullish
Managed Money accounts now control 38.1% of total open interest on the long side while holding only 3.2% on the short side. The positioning underscores the market's strong bullish bias.
At the same time, commercial participants remain heavily positioned against the rally. Swap Dealers hold 247,361 short contracts, equal to 60.9% of open interest, while Producer/Merchants remain net short as physical market participants continue to hedge elevated prices. Such positioning is typical during strong bull markets, with speculative funds driving momentum higher while commercial traders provide liquidity on the other side.
Crowded, But Not Yet Extreme
The key question for traders is whether positioning has become excessively stretched.
The answer appears to be "not yet." While the speculative net long position is sizable, it remains below the most euphoric readings seen during previous major gold bull runs. Moreover, rising open interest alongside expanding fund longs suggests new money is still entering the market rather than existing participants merely chasing prices higher. Open interest is often viewed as a gauge of capital flowing into futures markets.
However, crowded positioning increases vulnerability to sharp pullbacks if macro catalysts disappoint. With so many traders already leaning bullish, incremental buying power becomes harder to find, making gold more sensitive to shifts in Federal Reserve expectations, Treasury yields, or U.S. dollar strength.
Profitable Traders Are Betting Against the Rally
MarketFramework's MGC Positioning Edge introduces a notable bearish divergence beneath the bullish COT picture. Profitable traders are holding just 18% long exposure, leaving roughly 82% of their trades short, compared with 29% long exposure among unprofitable traders. That means profitable traders are about 11 percentage points more short than their losing counterparts.
The divergence does not necessarily mean gold is about to reverse. Instead, it shows that traders who have recently been more successful are positioning defensively even as Managed Money remains heavily long. If gold breaks higher, the large short exposure among profitable traders could fuel a short squeeze as those positions are forced to cover. Conversely, a failure at resistance could validate their bearish positioning and accelerate long liquidation among the crowded speculative longs.
Technicals Point to a Critical Inflection Zone
The positioning divergence becomes particularly important at the chart's current inflection point. Gold's technical structure suggests the market is approaching a level where either the bullish COT positioning or the more cautious profitable-trader positioning could be validated.
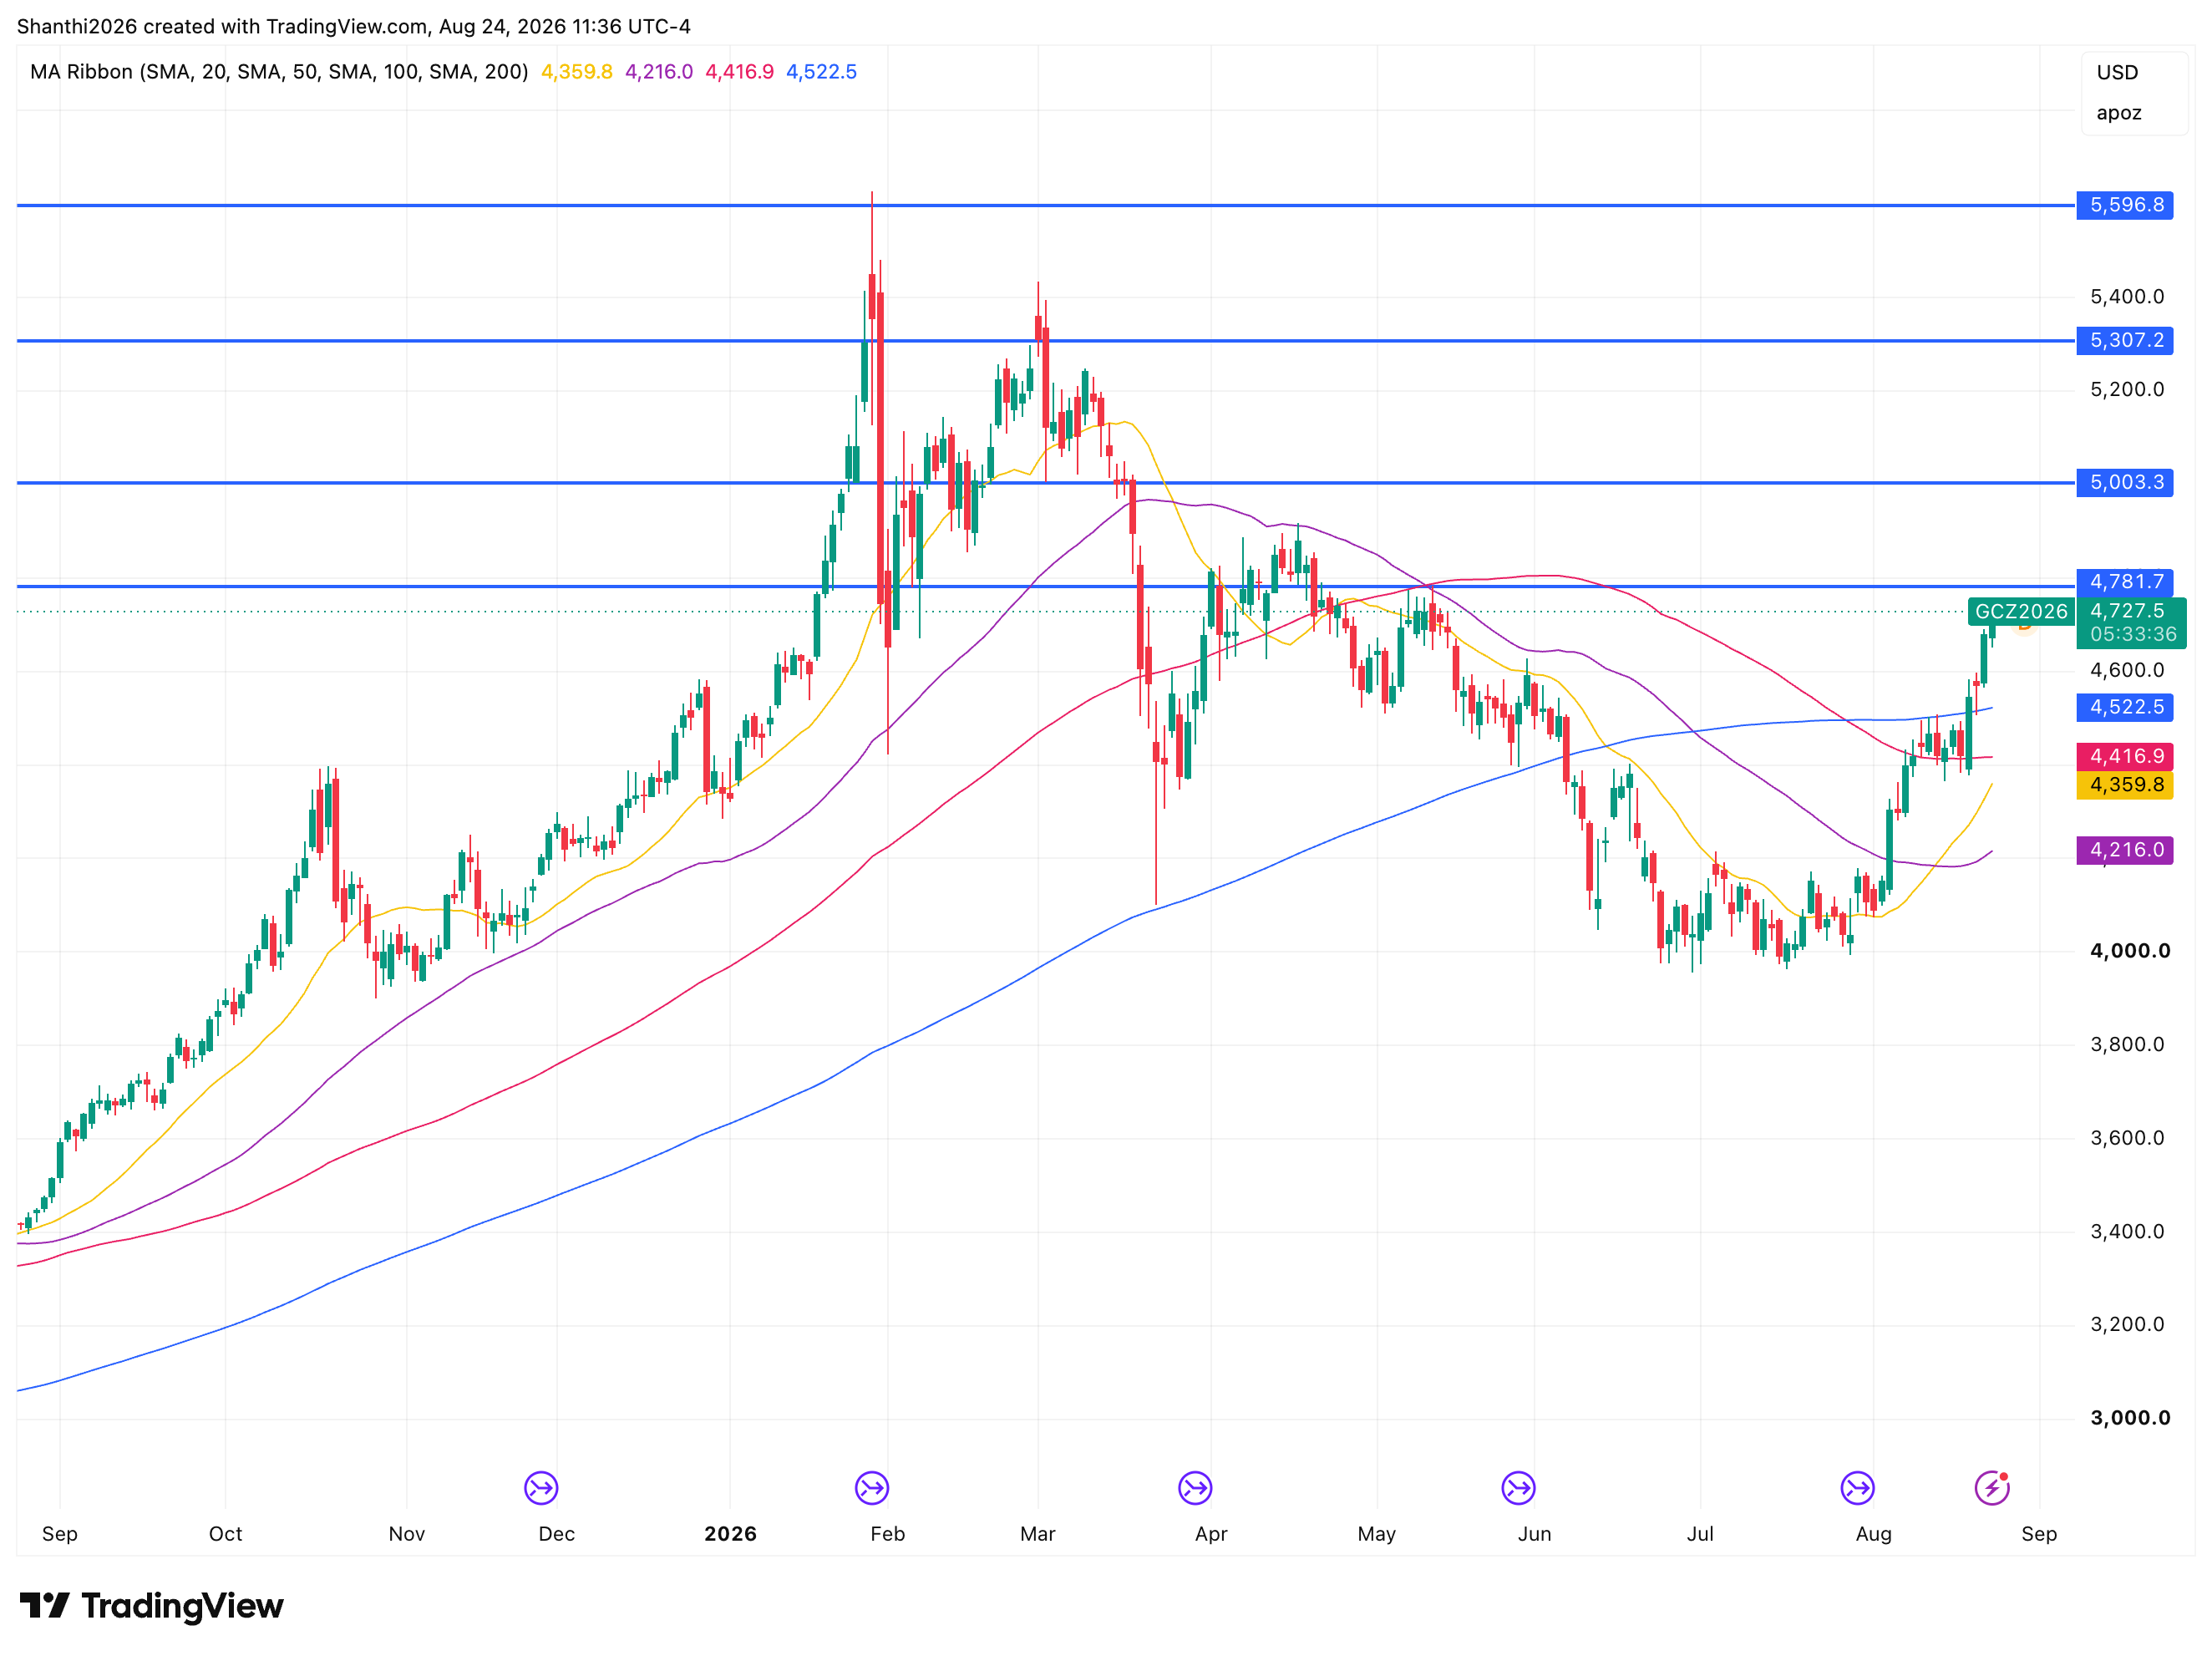
A powerful, sustained uptrend from around $3,500 in early September 2025, gold futures rose to a peak near $5,586.20 in Jan. 2026, roughly a 50% rally. Since that blow-off top, price has been in a broad distribution phase. A sharp drop ensued followed by a secondary high near $5,400 in March, then grinding to near the $4,000 level in July. The rally off that low has helped gold recover to the $4,730 level.
All for simple moving averages (SMAs) rose in a clean stack through the entire uptrend, a textbook bullish structure. In March, the ribbon inverted as price rolled over, with the shorter-term MAS crossing below their longer-term counterparts, suggesting the trend change is corrective or bearish. ‘
The ribbon itself is compressed or tangled, with the 20, 50, 100 and 200-day MAs sitting between 4,216 and 4,522, which is typical of a base being built after a downtrend, and not yet a fully re-established uptrend.
Source: TradingView
For bulls, a decisive breakout above recent highs would likely force trend-followers and systematic funds to add exposure, potentially extending the rally toward new record territory. In that scenario, the already-large speculative long position could become even more crowded before reaching exhaustion.
On the downside, failure to break higher could trigger a round of long liquidation. Given the large concentration of speculative longs, even a modest shift in sentiment could produce an outsized correction as funds rush to lock in profits.
Key Structural Levels
Resistance: 4,781.7 (immediate, just overhead), then a big gap-up to 5,033.2, 5,307.2 and the cycle high of $5,586.20
Support: the $4,000 zone, where the price bounced from essentially the same level twice (June and July), making it a strong reference point if the rally fails.
What Positioning Says About the Next Move
The latest positioning data sends a mixed but still constructive signal. CFTC data show Managed Money carrying a massive net-long position, while rising participation and continued additions to fund longs suggest the bullish trend has not yet reached a clear speculative extreme. However, MarketFramework's MGC data show profitable traders leaning heavily short, creating a bearish divergence beneath the surface.
That leaves gold at an important positioning crossroads. A decisive break above resistance could force short-covering among profitable traders and potentially accelerate the move toward new highs. Conversely, failure to clear resistance could expose the crowded Managed Money long position to liquidation, particularly if Treasury yields rise, the dollar strengthens or Federal Reserve expectations turn less supportive.
For now, the positioning evidence favors consolidation-to-higher prices, but the divergence means the next breakout or rejection could be unusually consequential.


