
The mood is cautious rather than fearful. Stocks opened mixed as long-dated Treasury yields edged higher, while oil eased. WTI fell about 2% to near $90.70 after Saudi Arabia resumed exports through its East-West pipeline and U.S .and Iranian officials held indirect talks through mediators.
Lower oil helps, but bond yields remain the main weight on stocks. The 10-year yield sits near 5.24%, close to its highest since 2007, and the 2-year is around 4.94%. Traders now see roughly a 72% chance the Fed raises rates again on Oct. 28. Higher yields make stocks look expensive and hurt rate-sensitive sectors the most.
Fed speakers Barr, Goolsbee, Musalem and Williams follow through the day. And Iran says it hopes to receive Washington’s reply through Qatari mediators today, which could move oil and yields at any moment.
Looking further out, PCE inflation lands tomorrow and payrolls on Friday.
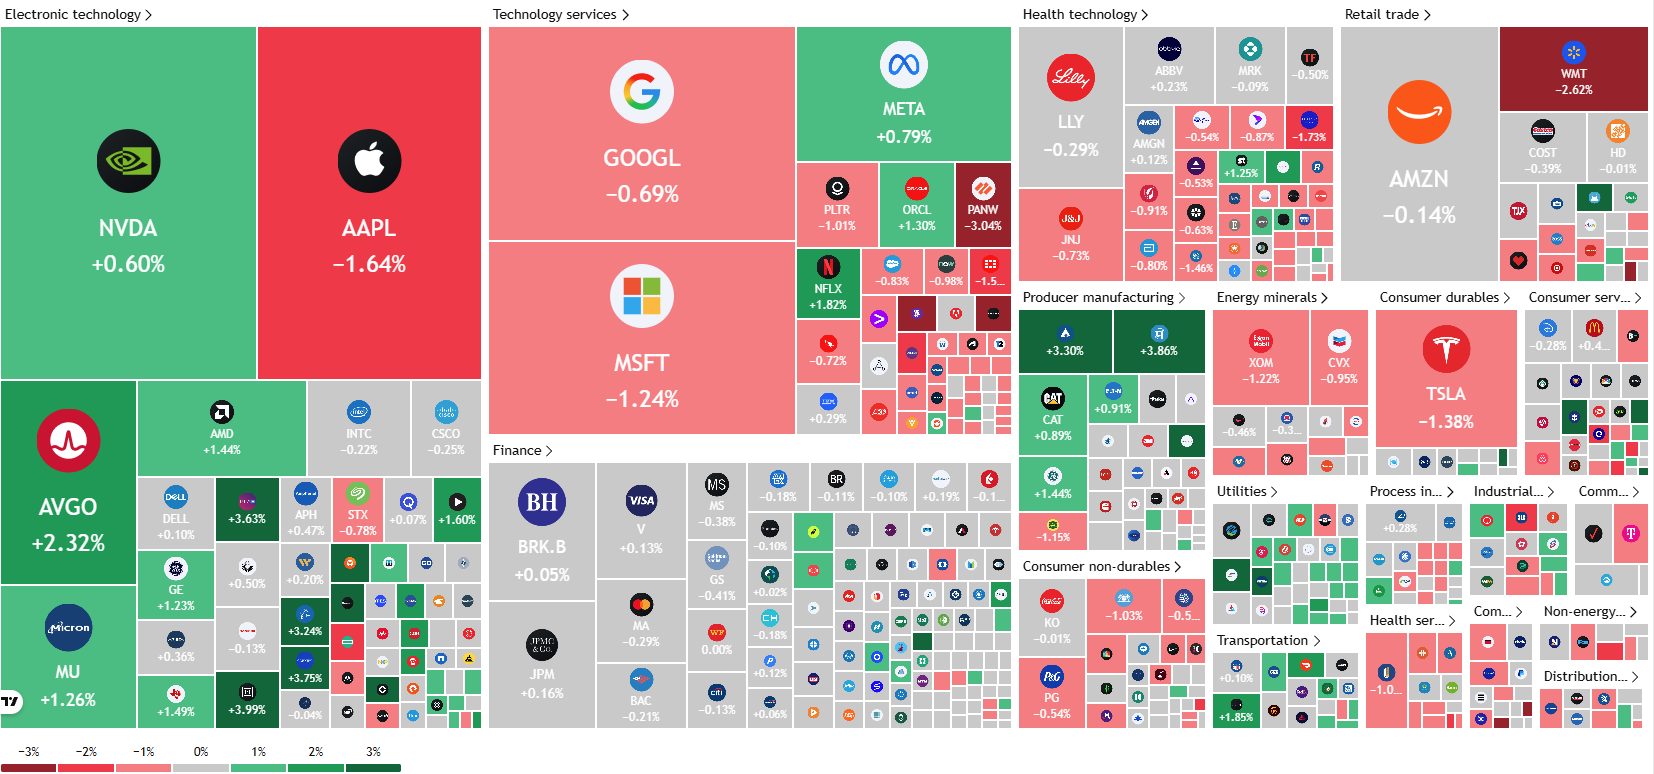
The Early Heatmap: A Split Tape
The opening heatmap shows a market that is not moving together. Chipmakers are firm, with Broadcom up 2.3%, AMD up 1.4%, Micron up 1.3% and Nvidia up 0.6%. Meanwhile, the biggest index weights are lagging: Apple is down 1.6%, Microsoft 1.2%, Tesla 1.4% and Alphabet 0.7%. Energy names such as Exxon (−1.2%) are falling with oil, and Walmart is down 2.6%.
When the heaviest stocks are red, it is hard for ES to rally far, even with pockets of strength. That fits Goldman Sachs’ warning this week that S&P 500 breadth is at its weakest since the dot-com era.
Source: TradingView
Hourly Chart: Lower Highs Under Converging Averages
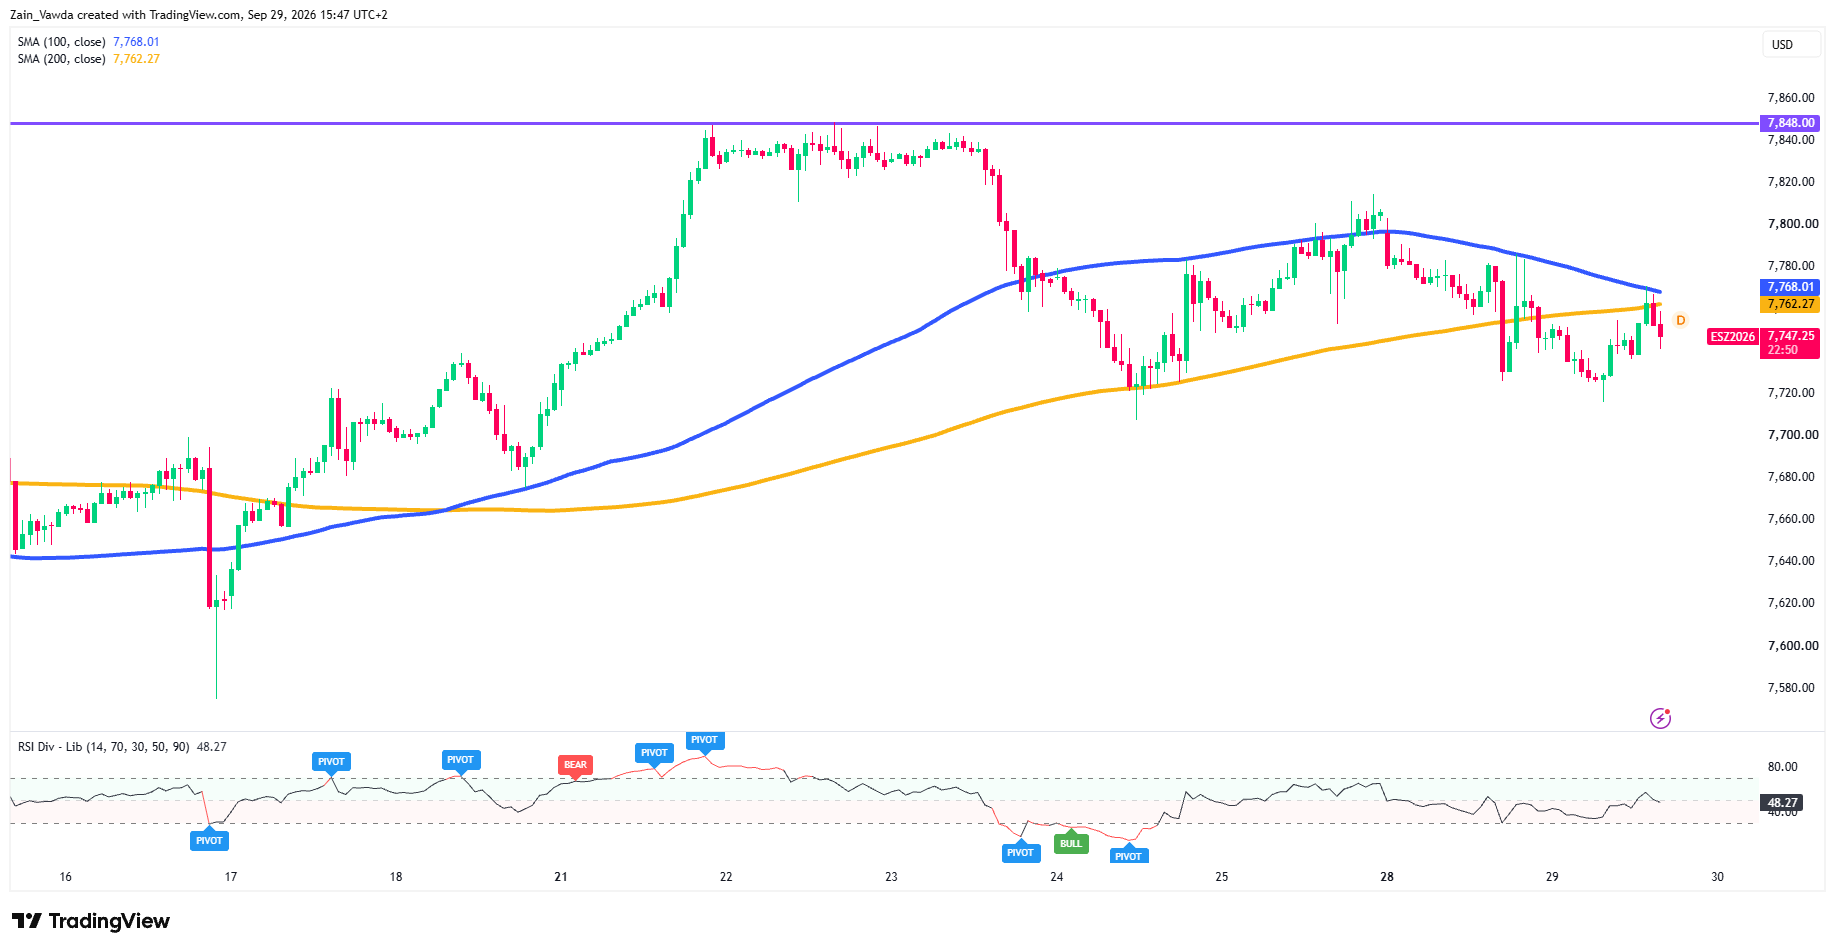
On the hourly chart, ES has made a series of lower highs since failing at 7,848 on Sept. 22–23.
S&P 500 (ES) One-Hour Chart, September 29, 2026
Source: TradingView
Rallies stalled near 7,812, then 7,786, and today near 7,770. Price now sits at about 7,747, below both the 100-period average (7,768) and the 200-period average (7,762), which have squeezed together.
On the downside, buyers have defended 7,707–7,720 twice, on September 24 and again today. RSI at 48 is neutral.
In short, the trend is sideways-to-lower until ES closes an hour above 7,770.
15-Minute Chart: Rejection at the Ceiling, Now Testing VWAP
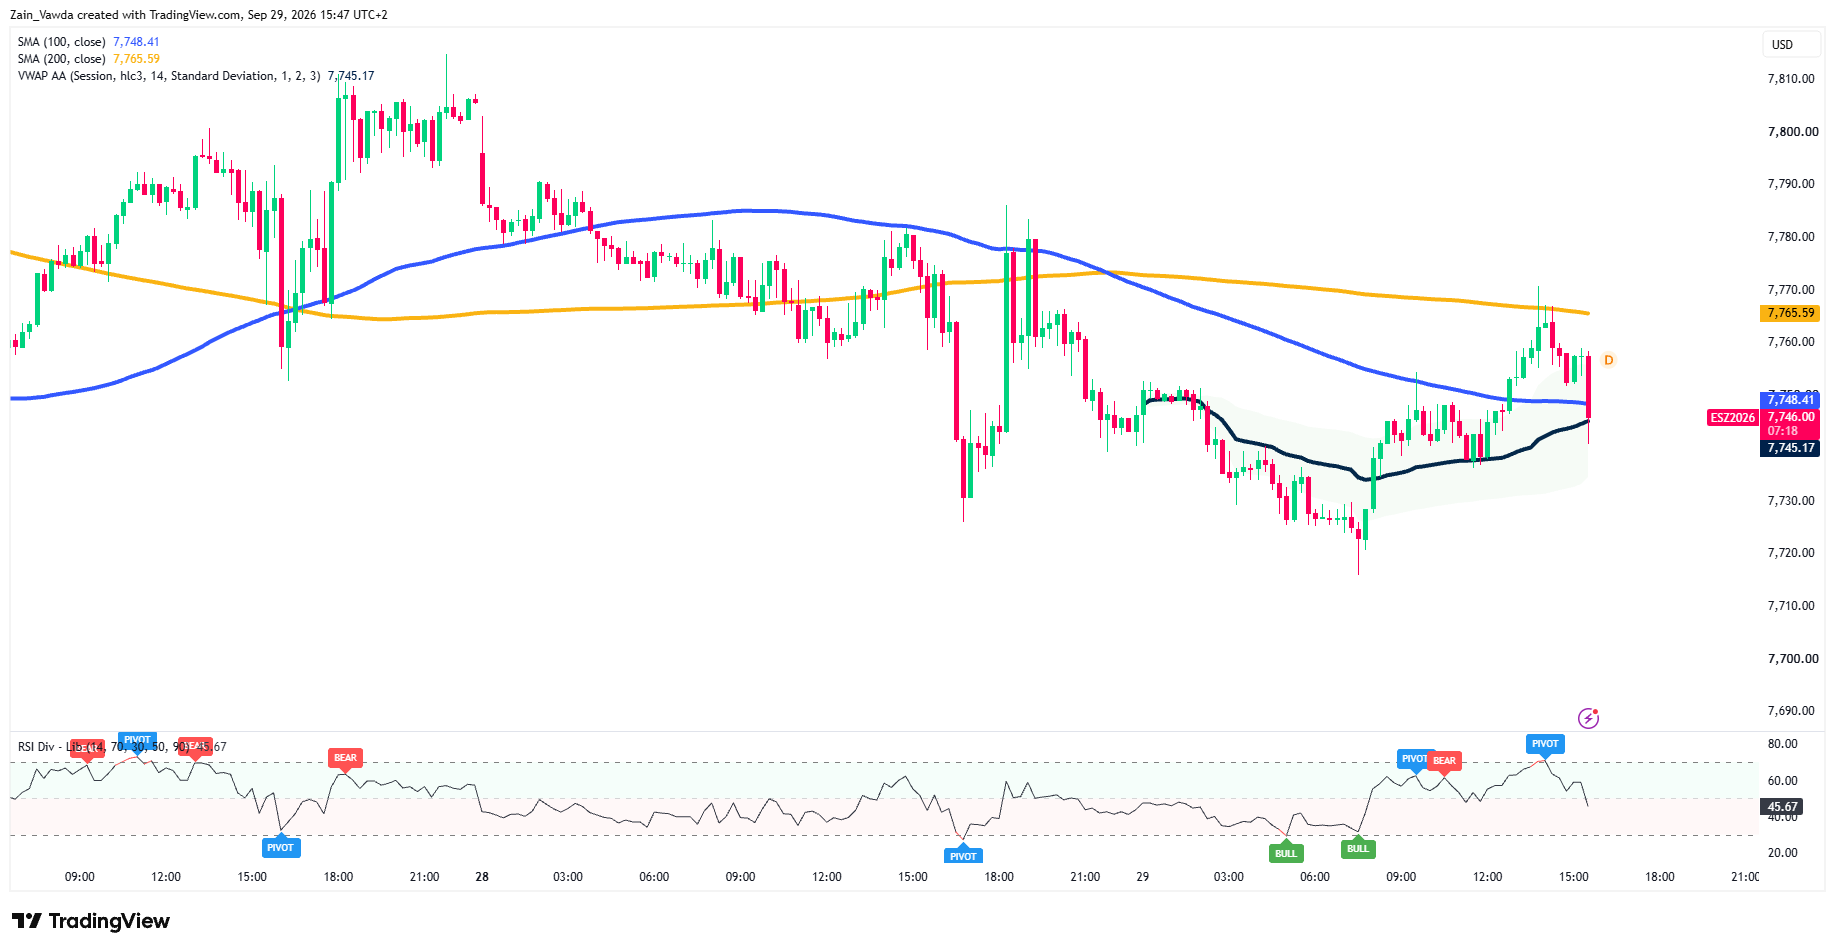
The shorter chart shows today’s story clearly. After a low near 7,716, RSI flashed bullish divergence and ES rallied through session VWAP and the 100-period average.
S&P 500 (ES) M15 Chart, September 29, 2026
Source: TradingView
The move then hit the 200-period average near 7,766–7,770 and turned lower, with RSI rolling over from near 70. The latest candle has dropped back to 7,745–7,748, where VWAP (7,745) and the 100-period average (7,748) meet.
Holding here keeps the morning bounce alive; losing it opens the lower VWAP band near 7,733.
Potential Scenarios for the U.S. Session
| Scenario | Trigger | Levels | What to Watch |
|---|---|---|---|
| Bull | calmer Fed talk or progress on Iran pulls yields lower | Hourly close above 7,770 targets 7,786, then 7,800–7,812 | Apple and Microsoft turning green would be a good sign |
| Base | No Iran headline | Chop between 7,733 and 7,770, VWAP 7,745 as the magnet | Mean-reversion around VWAP; fade the edges |
| Bear | Hawkish Fed talk lifts hike odds; Iran talks stall and oil bounces | Loss of 7,733 opens 7,716–7,720; a break exposes 7,700 | 10-year yield pushing through 5.25% |
Trader Positioning Insights
Marketframework Positioning Edge Tool displays an extreme bullish divergence for ES futures, currently trading at 7,740.50.
Profitable traders hold a distinctly bullish posture at 57% long, compared to just 42% long among unprofitable traders, a 14% positioning gap.
This breakdown indicates that winning traders are leaning long at current price levels, leveraging superior risk and trade management rather than superior entry timing alone.